The library
Decisions & trade-offs
What are we deciding, and what do we give up?
Frame a decision, compare competing objectives, and inspect what buffer, delay assumptions and new information change.
Examples, diagrams and reading sit together here. Dates and limitations belong to each piece; an earlier illustration is not a claim of current practice.
Interactive example
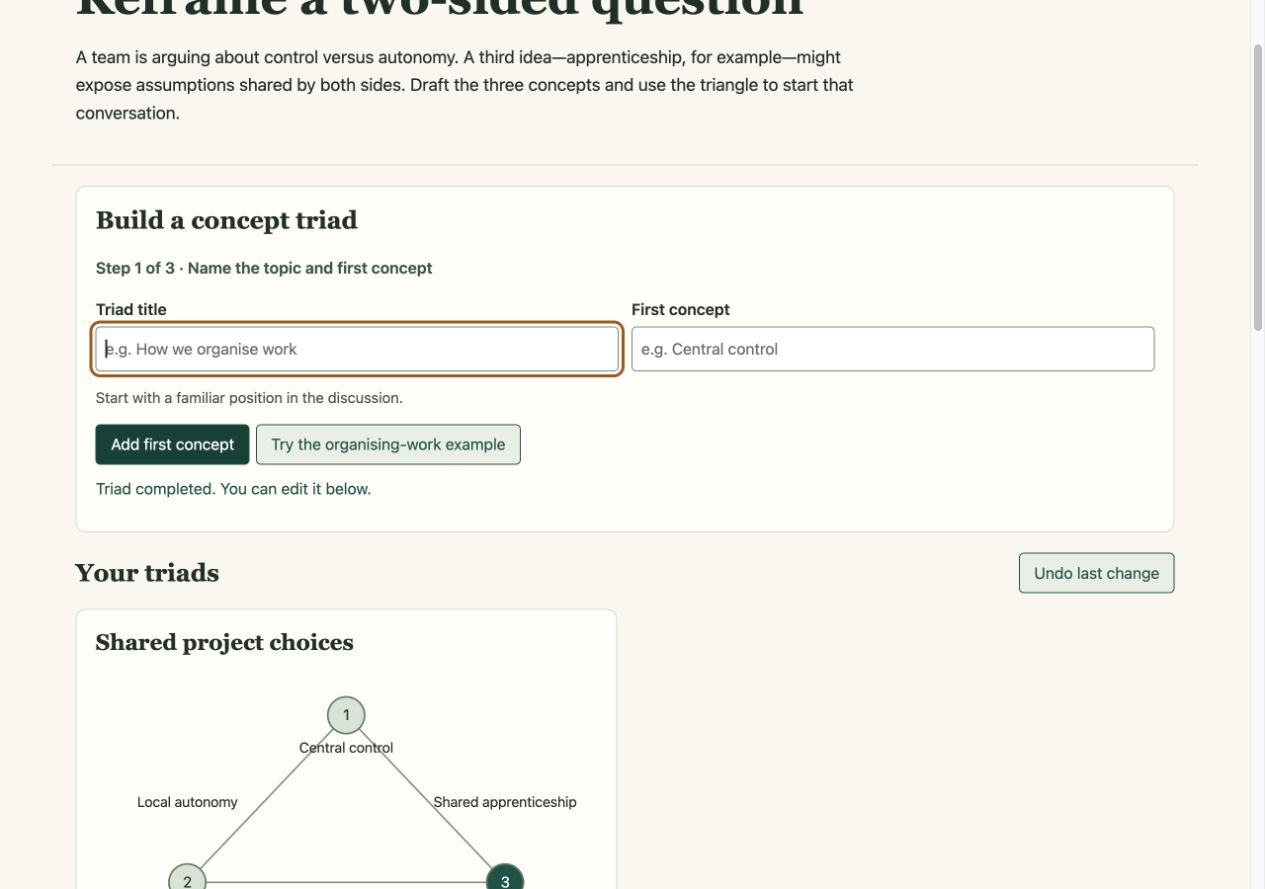
Reframe a two-sided question
Draft a third concept that helps a team question a familiar polarity.
What to try & what it leaves out
Try. Give a tension a title, enter the two familiar poles and a disruptive third term, then revise the resulting triangle.
Limits. Inspired by Dave Snowden’s trialectic method; this drafts the triad but does not collect participant placements or validate the reframing.
Earlier example, repaired and reviewed 2 October 2026. This review checks the stated model and interactions; it does not establish usefulness in practice.
GitHub source (may require access)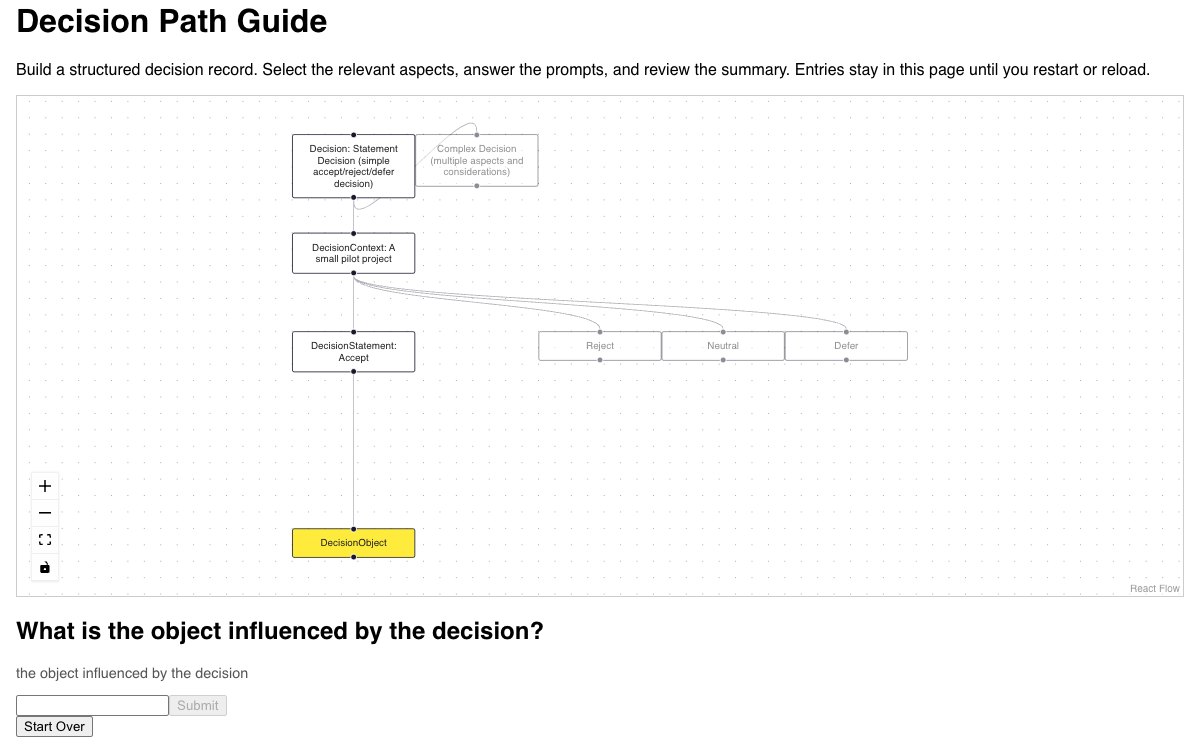
Interactive example
Find the kind of decision you are making
Use an ontology-inspired questionnaire to distinguish decision objects, statements and processes.
What to try & what it leaves out
Try. Try the same situation as a decision to be made and as an existing decision statement; compare the resulting paths.
Limits. A guide to useful distinctions, not an automatic decision maker or a complete ontology reasoner.
Earlier example, repaired and reviewed 2 October 2026. This review checks the stated model and interactions; it does not establish usefulness in practice.
GitHub source (may require access)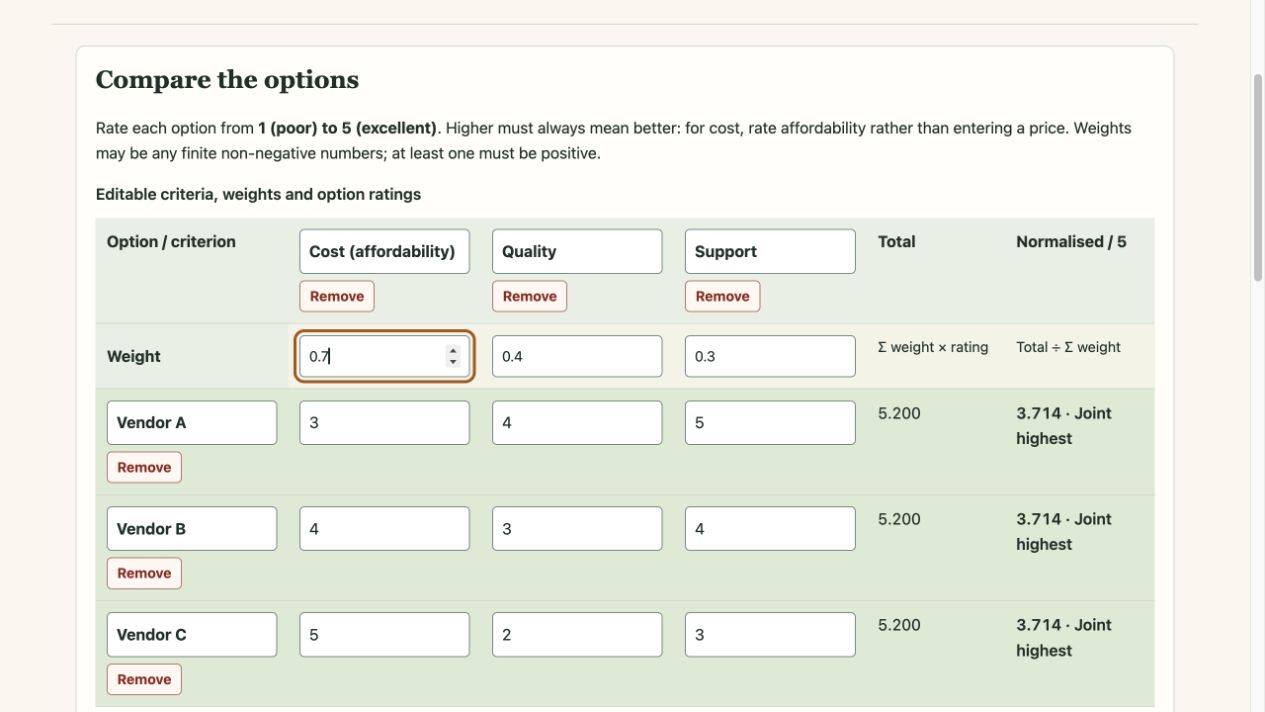
Interactive example
Compare options with weighted criteria
Make criteria, weights and scores explicit, then inspect how the ranking changes.
What to try & what it leaves out
Try. Raise the affordability weight to 0.7 and inspect the three-way tie. Change it again to reverse the ranking.
Limits. A compensatory weighted sum of supplied judgements; it does not discover evidence, enforce mandatory constraints or select the right option for you.
Earlier example, repaired and reviewed 2 October 2026. This review checks the stated model and interactions; it does not establish usefulness in practice.
GitHub source (may require access)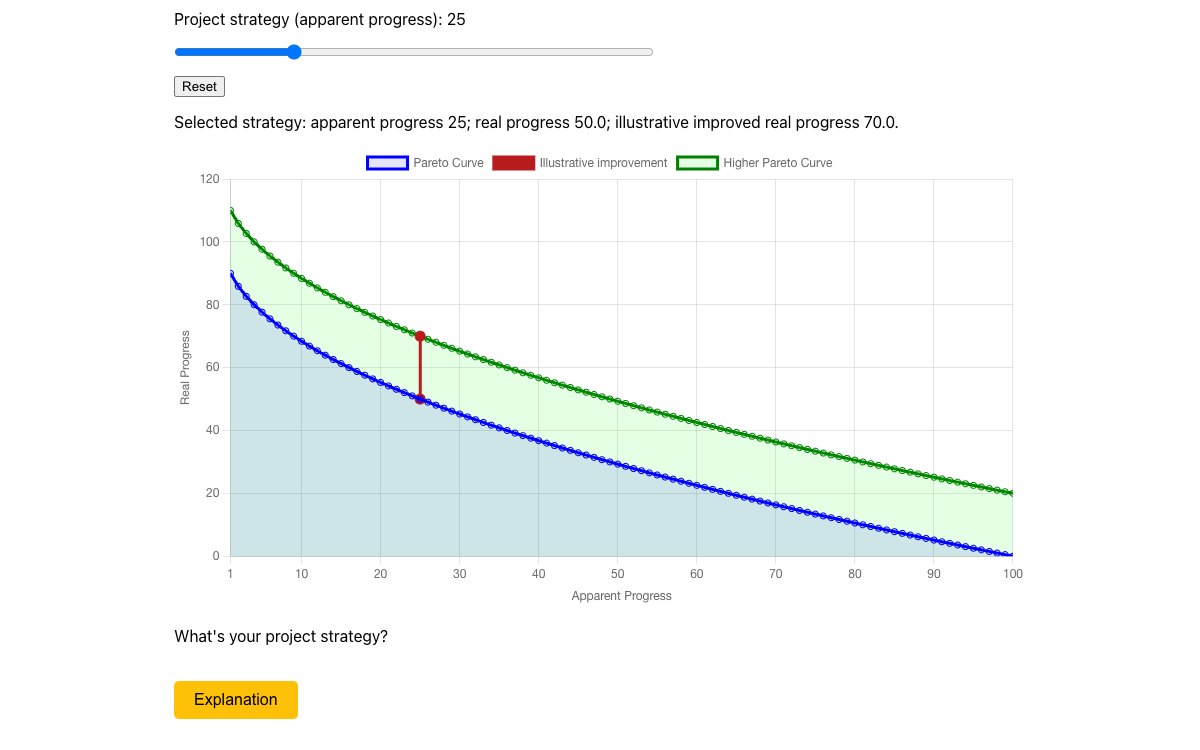
Interactive example
Find a better trade-off together
Compare allocation along a frontier with an illustrative outward change in what is possible.
What to try & what it leaves out
Try. Explore the points and the two objectives. Distinguish a better position on a frontier from improving the feasible options.
Limits. A drawn, illustrative frontier. The app does not derive an optimum, establish orthogonality or prove a win-win is feasible.
Earlier example, repaired and reviewed 2 October 2026. This review checks the stated model and interactions; it does not establish usefulness in practice.
GitHub source (may require access)Interactive example · Weighted path sampling
What do your decision weights imply?
A fictional software shortlist makes the supplied branch weights visible. Compare each option’s exact probability with sampled paths, then inspect the assumptions behind the result.
What this example leaves open
The tree and weights stay fixed. More samples reduce sampling noise; they do not learn which product is best, repair the assumptions or turn this into a recommendation.
Interactive example
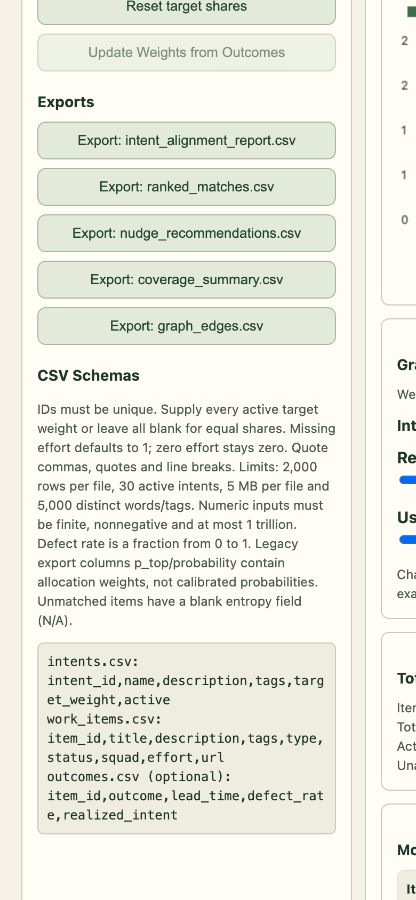
Compare a backlog with its stated priorities
Inspect how transparent keyword rules allocate backlog effort against a target mix of priorities.
What to try & what it leaves out
Try. Try the ambiguous-work example, inspect its candidate move, then change target shares and compare the coverage.
Limits. A lexical allocation heuristic. Wording matches do not establish actual strategic alignment, value or causal impact.
Earlier example, repaired and reviewed 2 October 2026. This review checks the stated model and interactions; it does not establish usefulness in practice.
GitHub source (may require access)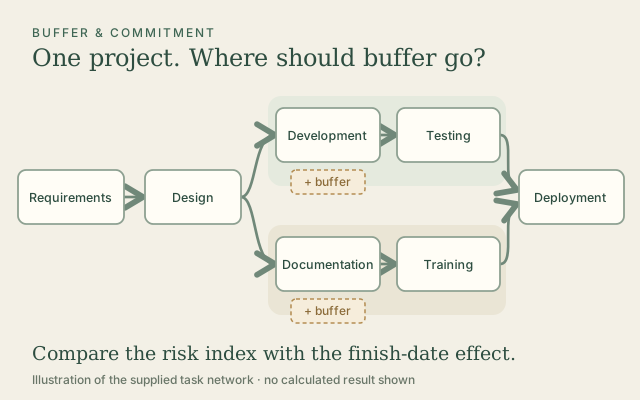
Schedule & risk assumptions
What does another day of buffer buy?
Allocate protective buffer across a seven-task software project. Compare the reduction in its illustrative risk index with the effect on the commitment date.
What to try, assumptions & source
Inputs. A fixed task network, supplied durations and risk coefficients, and a buffer setting of zero to ten days per task.
Try this. Start from reset. Add one day to Development, then reset and add one day to Documentation. Compare the risk-index change and finish-date effect; inspect the network to understand the difference.
Limits. This is an uncalibrated teaching model. Risk follows a supplied exponential formula with fixed baseline weights and slack. Finish-date effects are calculated separately; the ranking does not establish real risk reduction or an optimal allocation.
The original source was added on 10 July 2026. That is a source-commit date; the app does not state a separate capture or review date.
Earlier question · December 2020; reading diagram · 2026
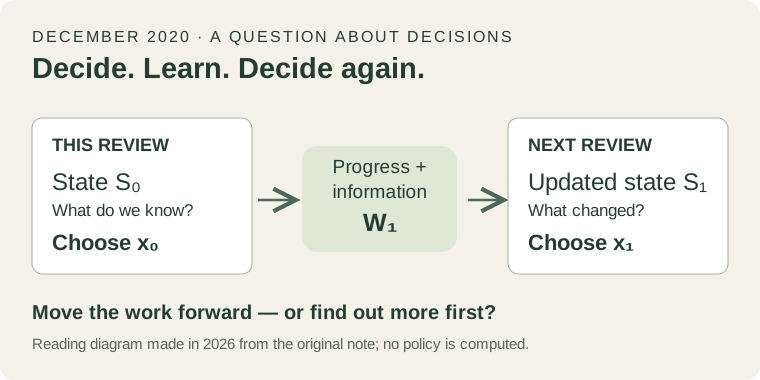
Decide now—or find out more first?
Today’s state and decision lead through progress and new information into the next review.
What this example leaves open
A 2026 reading diagram of a December 2020 question. The retained notebooks do not learn a policy, consume new evidence or model assurance.
Interactive example
Build and interpret a risk matrix
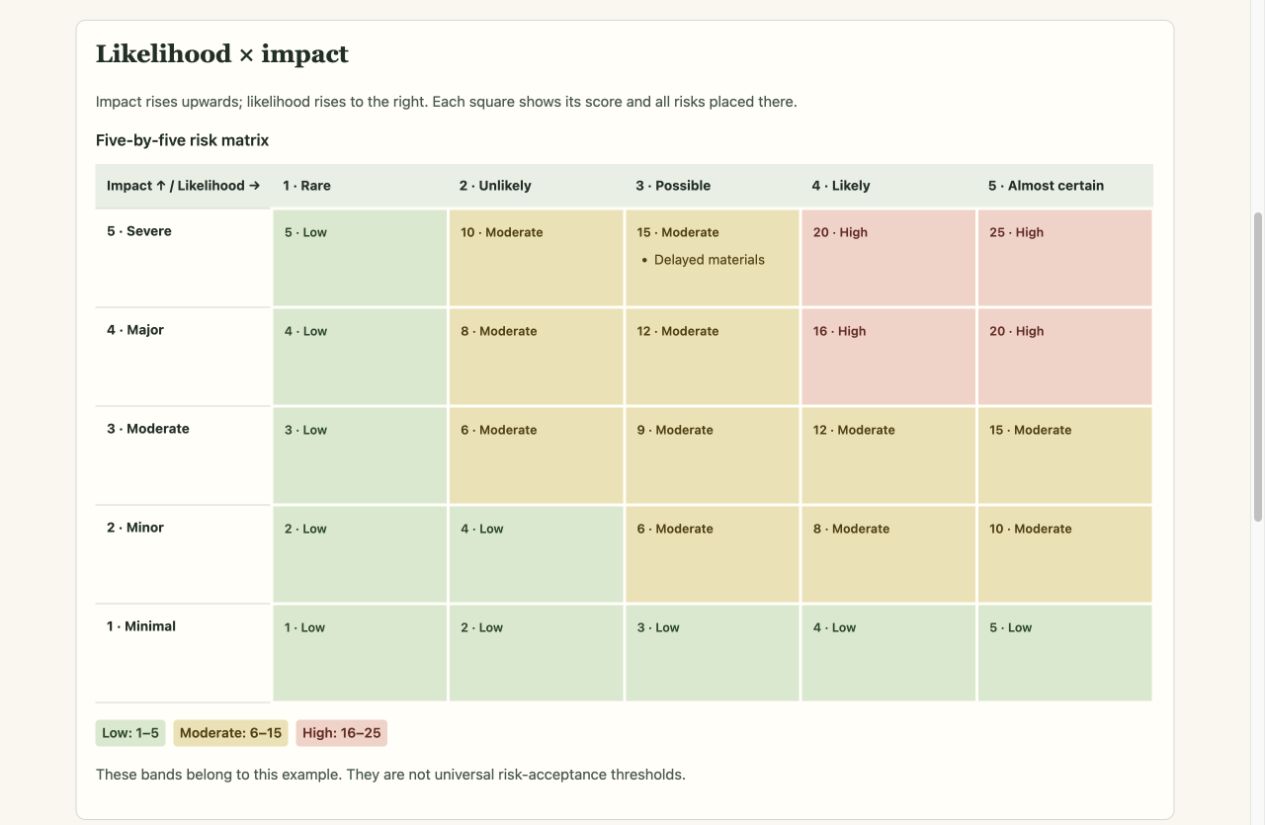
Place several risks on a likelihood–impact grid and inspect the rule behind its bands.
What to try & what it leaves out
Try. Add delayed materials at likelihood 3 and impact 5, then edit likelihood to 4. Add another risk in the same square.
Limits. Ordinal scores and colour bands are conventions, not probabilities, expected losses or proof that a risk is acceptable.
Earlier example, repaired and reviewed 2 October 2026. This review checks the stated model and interactions; it does not establish usefulness in practice.
GitHub source (may require access)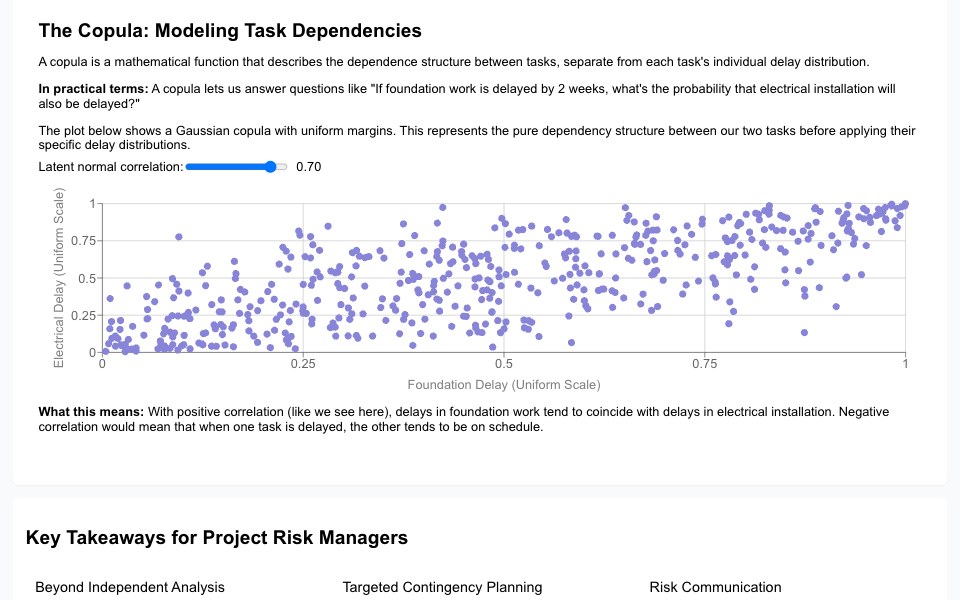
Interactive example
When do task delays happen together?
Separate each task’s delay distribution from their joint dependence.
What to try & what it leaves out
Try. Inspect the fixed marginal distributions, change the Gaussian dependence parameter and sample size, then compare the scatter and tail summaries.
Limits. Synthetic draws and a Gaussian copula. Its parameter is not generally the Pearson correlation of the displayed delays; extreme-tail dependence is not represented.
Earlier example, repaired and reviewed 2 October 2026. This review checks the stated model and interactions; it does not establish usefulness in practice.
GitHub source (may require access)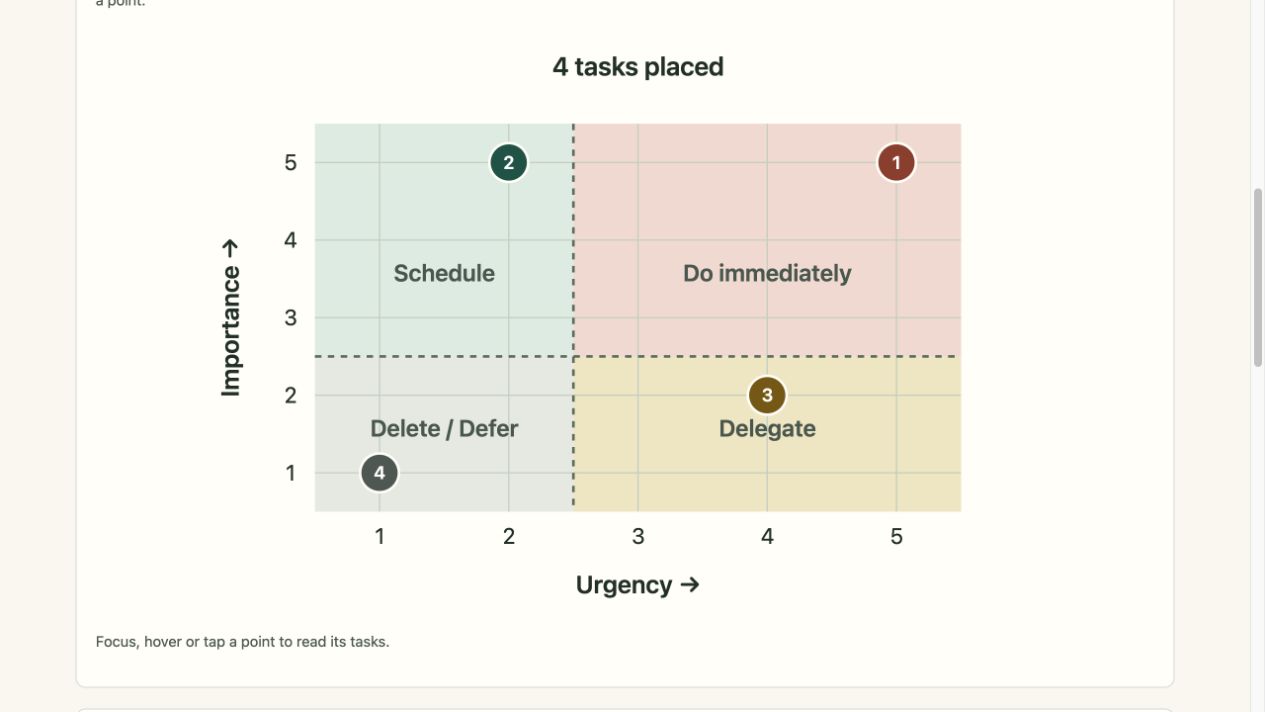
Interactive example
Sort tasks by urgency and importance
Place tasks on two distinct axes and reconsider their suggested next actions.
What to try & what it leaves out
Try. Add the examples and move Plan recovery drills from urgency 2 to 3 without changing its importance.
Limits. The midpoint is a chosen convention; suggested actions do not establish capacity, delegability or what a person ought to value.
Earlier example, repaired and reviewed 2 October 2026. This review checks the stated model and interactions; it does not establish usefulness in practice.
GitHub source (may require access)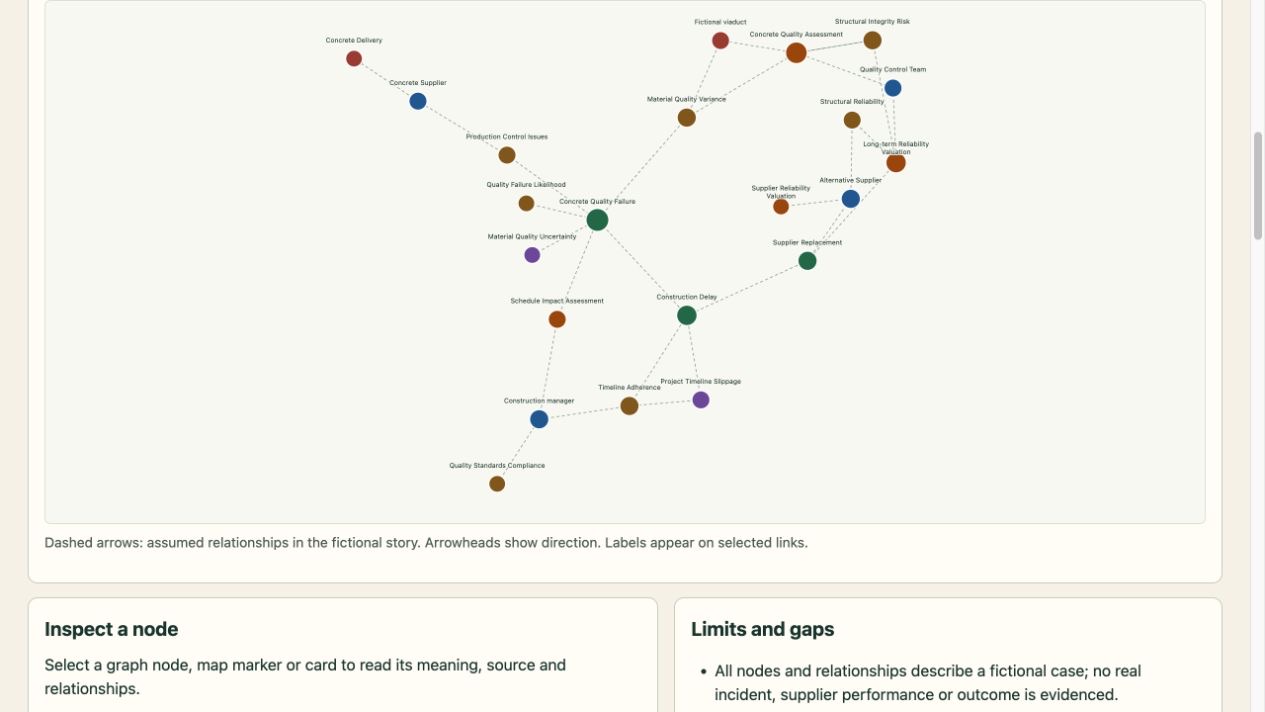
Interactive example
Follow a decision through a project graph
Trace quality, risk, action and value in a fictional viaduct supply-chain scenario.
What to try & what it leaves out
Try. Follow the story, inspect a relationship direction, then compare the different views.
Limits. A fictional teaching scenario inspired by HS2; no claim of an actual quality failure or computed best decision.
Earlier example, repaired and reviewed 3 October 2026. This review checks the stated model and interactions; it does not establish usefulness in practice.
GitHub source (may require access)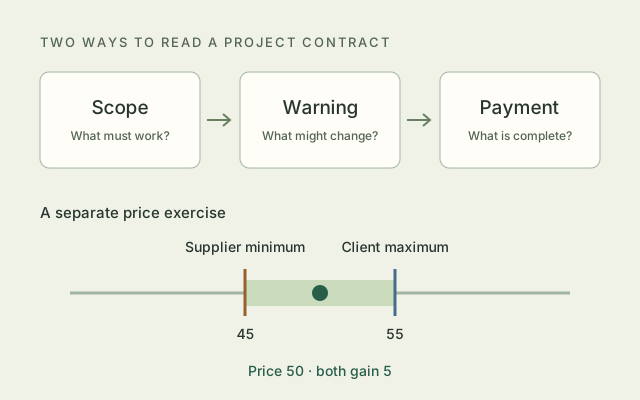
Interactive example
Explore a project agreement
Follow a seven-part NEC lesson, then bargain over five illustrative rail packages.
What to try & what it leaves out
Try. Compare the supplier’s minimum with the client’s maximum, then test whether their offers can actually meet.
Limits. A simplified NEC4 ECC lesson and declared bargaining rules; no model of an actual HS2 contract or negotiating party.
Earlier example, repaired and reviewed 3 October 2026. This review checks the stated model and interactions; it does not establish usefulness in practice.
GitHub source (may require access)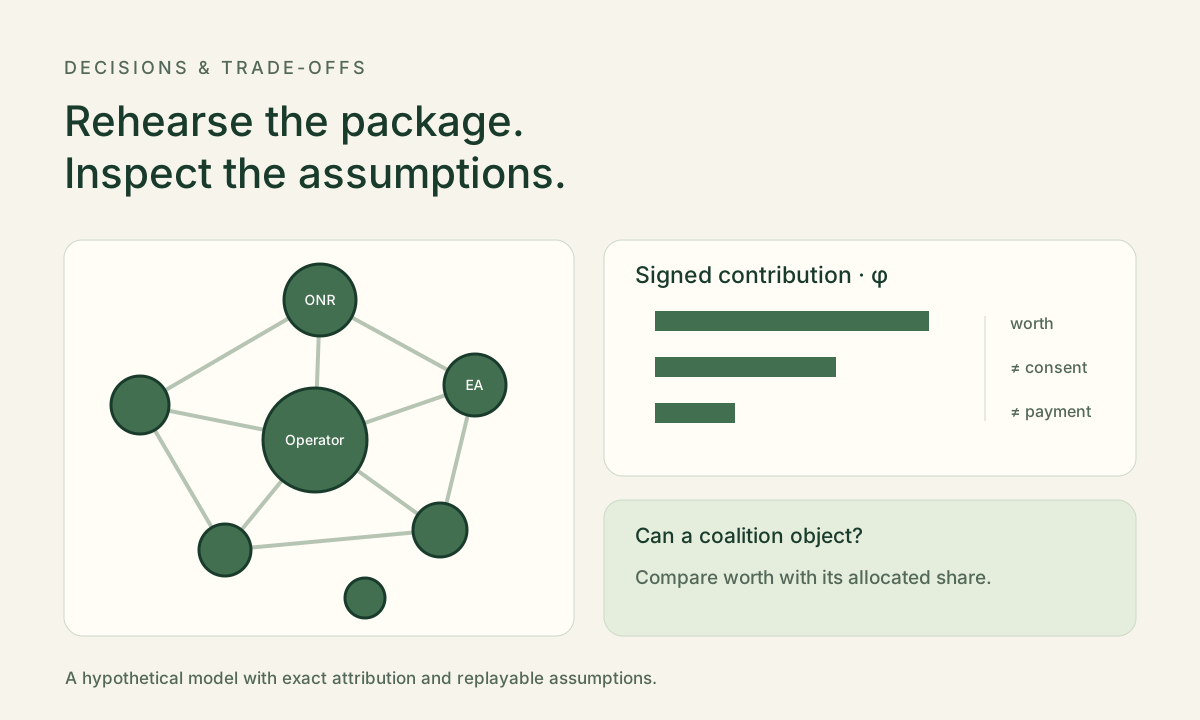
Interactive example
Rehearse a regulatory negotiation
Explore how a fictional package of commitments affects joint value, coalition contributions and consent scores.
What to try & what it leaves out
Try. Change a lever or party assumption, compare the resulting coalition contributions, then save a reproducible receipt.
Limits. Illustrative worth and consent formulas, not measured regulator behaviour, an approval probability or a binding allocation.
Earlier example, repaired and reviewed 3 October 2026. This review checks the stated model and interactions; it does not establish usefulness in practice.
GitHub source (may require access)