US IT portfolio: a guide to the original walkthrough
September 2020 example · reading guidance added 1 October 2026.
Start with a management question, follow the relationships that bear on it, and inspect the records behind the answer. The original walkthrough below makes this visible through suppliers, investments, projects, activities and measures. Its pictures and wording are retained; its historical results have not been rerun or independently reproduced.
Read the illustrated case study in the Library →
Choose a route
- Follow questions: continue into the original pictured walkthrough below, from common suppliers to project delays and metrics.
- Understand the structure: inspect the schema, then the FDA subgraph. The Health hierarchy note gives a top-down draft, with its counting inconsistencies explained at the entrance.
- Inspect how the views were selected: original Cypher queries. These preserve the historical query text; they are not a checked modern query library.
- Connect the model to management practice: governance and implementation choices, including three contrasting routes through data, modelling, handover and reporting tools.
- Inspect the retained resources: original PDF, FDA demonstration film (MOV), notebooks and files, and graph exports and incomplete setup notes. Reading needs no database; importing or running these files is a separate, unverified task.
Corrections to keep beside the original
- Date and coverage: the original credits ProjectingSuccess / Project Hack and Oxford Business School for US government IT records described as 2013–2018, restricted to research and development. It says rows with incomplete information were dropped. This is a historical subset, not a current or complete picture of US government projects. No broader permission is inferred from public availability.
- What is counted:
Investmentis a source node type, not automatically a programme. Static inspection of the complete export finds 7,249 Investment records, of which 437 have names, and 1,910 Project records, of which 1,547 have names. The headline figures match these named subsets. Investment identifier strings are unique within this export; that does not independently validate their real-world identity. Matched query rows are a third counting unit. The database has not been rebuilt. - Ratings and money:
Evaluation_by_CIOis a CIO evaluation, not a client-satisfaction score. The £82m statement conflicts with the field nameEnhancement_spend_$m; no currency conversion is shown. Treat the amount/currency as unresolved. - HR and Health totals: the HR section switches between 6 and 8 programmes and 20 and 17 delayed projects. The separate Health export has 721 Investment records (22 named) and 202 Project records (108 named); its totals include unnamed records. Its 11 Bureau, 18 Business_Function and 29 Service records clarify the hierarchy draft’s conflicting “6 Bureaus” and second “Business Functions” heading.
- Metrics and delay:
count(t.Description)counts non-null descriptions in matched rows; it does not count distinct programmes. Multiple delayed projects can repeat a metric. Summed project-delay days are not the elapsed delay of a whole portfolio, and an average start delay cannot establish why work finished late. The original causal suggestions remain untested. - Supplier picture: the original says five IBM records, but its picture contains six purple supplier nodes. The nine orange nodes mix organisational levels; “departments” is not a precise node-type count.
- Setup: the original sandbox is retired. The setup draft contains unresolved duplicate handling and destructive cleanup statements. It is retained as historical working material, not instructions to apply to an existing database.
Original September 2020 walkthrough
The complete original follows. Read its answers with the dated corrections above; the saved pictures are evidence of the earlier demonstration, not a fresh analysis.
Managing a portfolio within a graph database
A graph database makes it easy to:
- see business dependencies
- start managing a simple project data model
- incrementally update both data model and portfolio as things mature.
I introduce a real portfolio comprising 1547 projects from the practical perspective of management questions that arise during delivery. If it’s not a question you would ask, skip to the next one. Then I describe the whole portfolio, and explain the benefits of a graphical approach.
Q: How many programmes are dependent on our largest single supplier ?
A: IBM is the largest supplier, with 16 programmes across 9 departments
16 programmes are shown in green, belonging to (orange) departments.
(The common supplier is shown in purple. It is shown as five separate entities because, unhelpfully, each department uses a different supplier code for IBM. This problem is easier to see visually as a graph, and can now be rectified)
What metrics control these particular programmes ?
A: The IBM programme metrics focus on reliability, service access and cycle-time
Metrics are recorded under different Measurement_categories. This table shows the most frequent categories applied to this Supplier’s programmes. We may wish to add in some metrics around supplier capacity.
Overall, which metrics are met most often ?
A: Quality and reliability metrics are met the most
Each metric has a property show whether the Metric is being met. For example, across the portfolio, 300 programmes apply some sort of metric for ‘Customer results’, and of these 102 are not being met.
Across the portfolio, the 3 metrics least met are:
- Customer results
- Management of Resource
- Technology effectiveness
The 3 metrics most met are:
- Service Quality
- Reliability
- Procedural quality
| Measurement Category | Met | Not met | % met |
|---|---|---|---|
| Customer Results: Benefit | 198 | 102 | 66% |
| Business Results: Management of Government Resources | 141 | 70 | 67% |
| Technology: Effectiveness | 111 | 53 | 68% |
| .. | .. | .. | .. |
| Process and Activities: Quality | 72 | 17 | 81% |
| Technology: Reliability and Availability | 504 | 100 | 83% |
| Customer Results: Service Quality | 167 | 30 | 85% |
How many programmes are given low scores by clients ?
A: Out of 437 programmes, only 8 score badly.
Each programme is evaluated 1-5 by the CIO. These are the 8 programmes, alongside the Business Service the programme is meant to be providing.
We see that Systems & Security Management programmes feature prominently.
What is the lowest scoring programme?
A: A programme delivering HR resource management to Dept of Agriculture
It has one large project (blue), 4 suppliers (purple) delivering 5 contracts (pink).
A manager would then want to look at similar programmes across the portfolio.
How much money is being spent on similar HR programmes ?
A: There are 6 similar programmes, totalling £82m of capital spend
How much delay is there to projects on these programmes ?
A: Altogether, 7894 days delay is spread across these 20 HR projects
That is a lot of delay. Here are those projects, which appear to be concentrated in 4 of the 8 similar HR programmes.
There are 17 other HR projects which have experienced no delay, including all projects on the four remaining programmes (not shown).
So what tasks are in the schedules of these 17 delayed projects
A: There are 22 main activities/tasks listed for these delayed projects
The activities (light blue) are concentrated across 2 of the delayed investments, because no data was recorded on activities for the other 2 delayed programmes.
Are these tasks finishing late because they are started late ?
A: No. On average they only start 4 days late
There are records for start delay associated attached as a property of each activity. Mean start delay across all 3827 activities is 1.5 days, compared to 4 days here, so late starts are not the problem here.
So which types of programmes do have significant start delays?
A: Ironically, programmes to deliver ‘Controls & Oversight’ have the latest starts, on average 19 days late
Here are the slowest programme types:
Show all of programmes of this programme type
A: There are 5 programmes to deliver ‘Controls & Oversight’
Here are the 5 programmes, showing the associated 8 projects and 38 activities:
At portfolio level, 7 types of business service have been defined. One of these is Knowledge Discovery Services. Which programmes are planned to implement such new Services? What business outcomes are associated with these programmes?
A: 6 programmes provide this Service, with outcomes planned in science services, environmental mgt and economic development
This shows the service (pink) to be delivered by the programme as well as the type of business outcomes /business function (orange) that have been set for the programme.
Within the portfolio as whole, there is a hierarchy of 32 business functions, arranged into 3 business areas, which relates to the business architecture created for the entire Enterprise.
For projects delayed more than 100 days, which programme level metrics were not being met ?
A: Customer responsiveness metrics are not being met on 71 programmes where there was at least 1 late project
Here are the top 3 failing metrics on programmes where projects are 100 days or more late:
It might be worth monitoring these metrics more closely.
We also looked to see the opposite, which metrics are still showing as being met, despite having at least one very late project ? Reliability is often still met, suggesting project delay can be about getting this right at the end.
The portfolio overall
This portfolio has 437 Investments/programmes. These have:
– 1547 Projects across 3827 Activities
– 706 Suppliers across 1402 Contracts
– 3462 Metrics/KPIs
Strategic alignment is linked to
– 32 Business functions
– 30 Services
These are delivered by 26 Departments organised into 81 Bureaus.
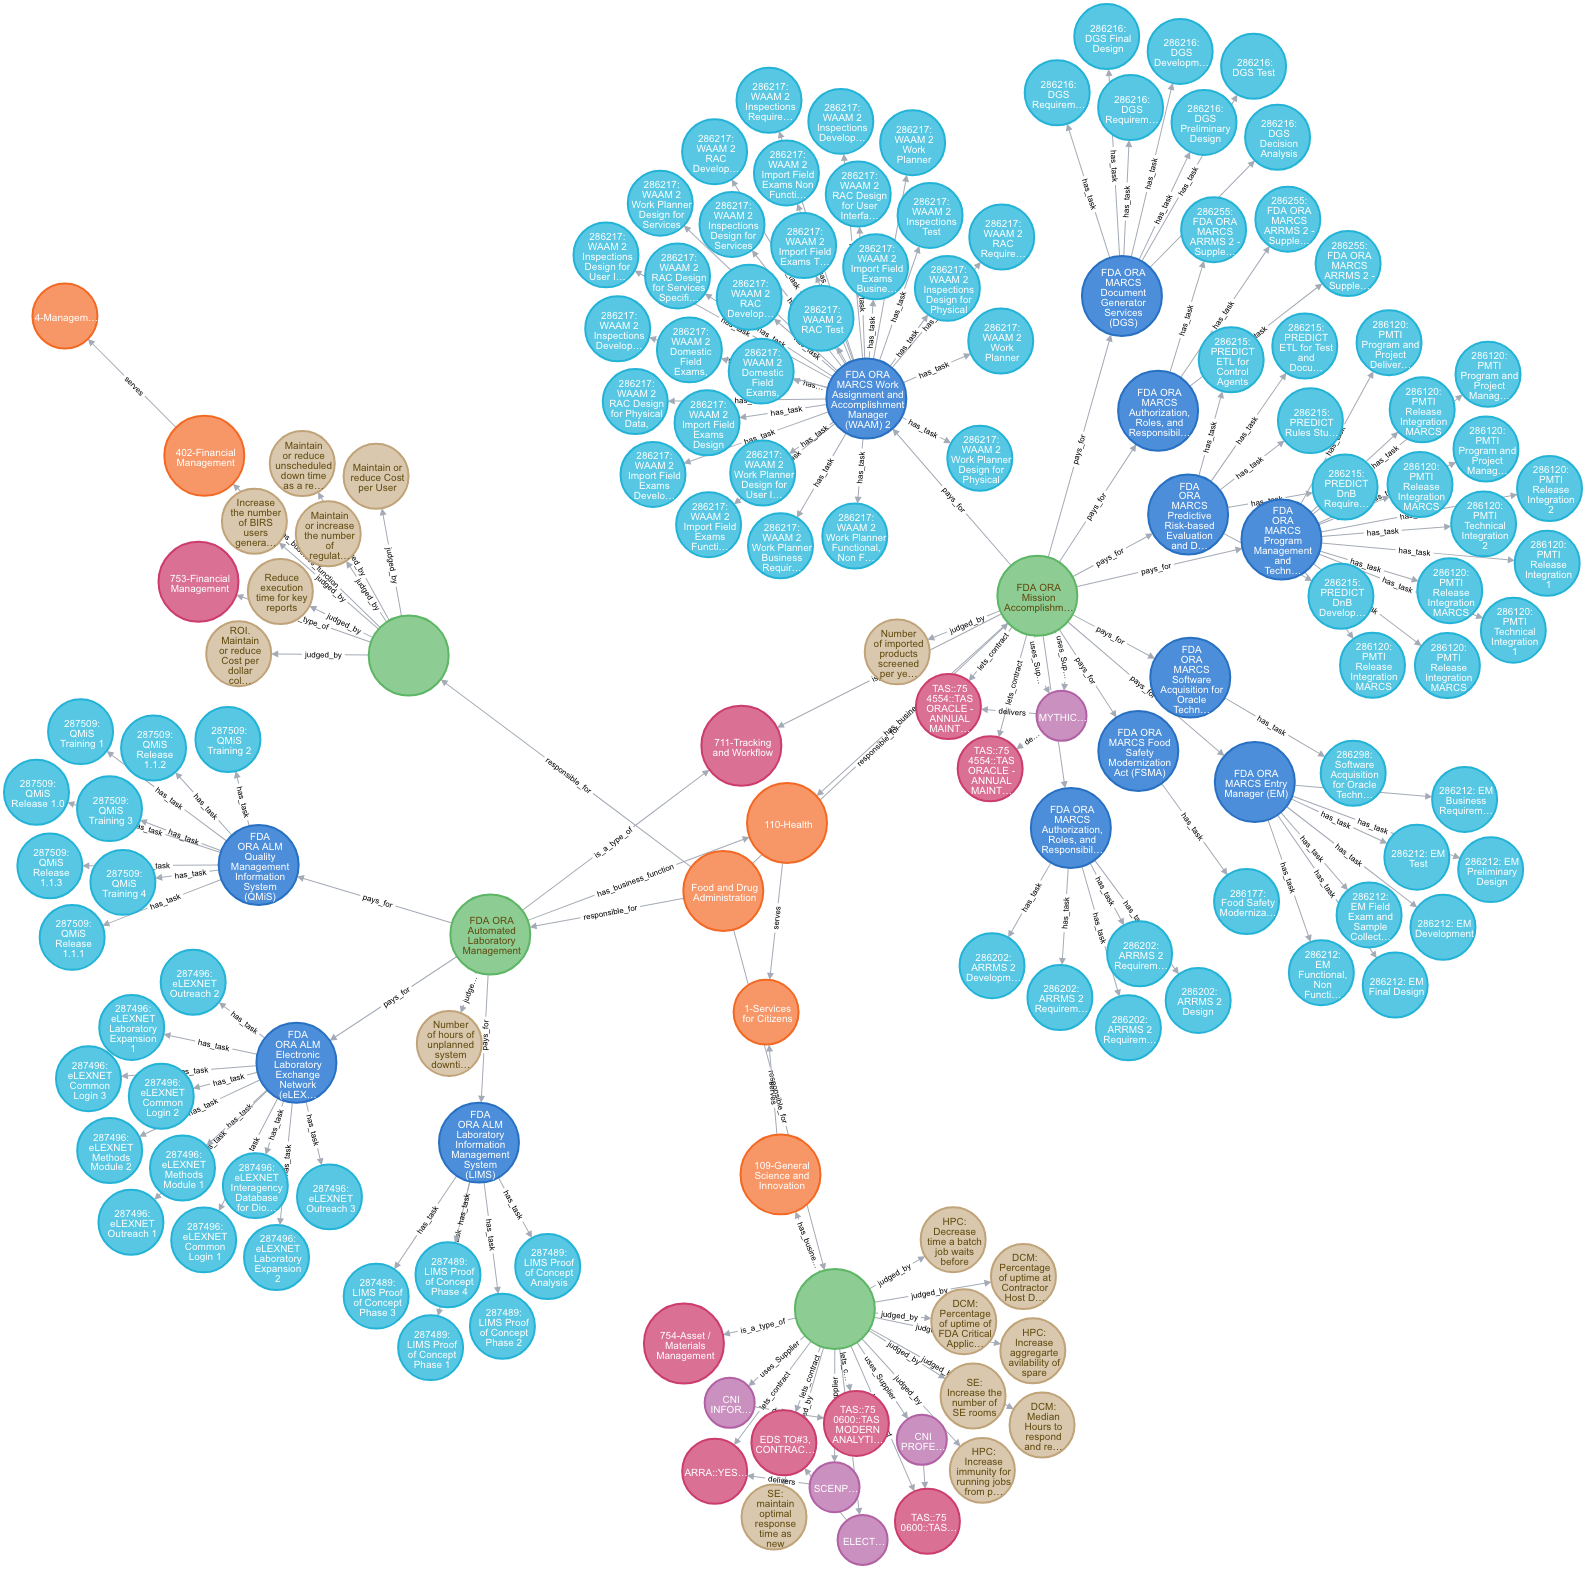
The work of 1 department, as an example (the Food & Drug Administration)
One department (or bureau) runs 12 projects, comprised of 94 activities within 4 investments, 2 of which are programmes. These are controlled by 16 metrics, using 5 suppliers on 6 contracts, delivering 3 types of service as 3 business functions. One can pull out whichever department or programme one is interested in.
Schema
Altogether there are 18,728 nodes, with 28,771 relationships between them. This covers the entire portfolio. At any one time, one only needs to see the sub-set or sub-graph relevant to a particular programme manager or client.
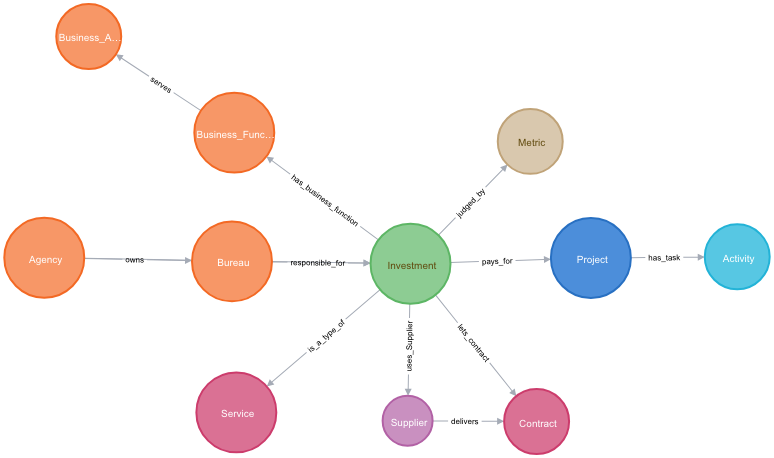
Everything follows one simple pattern, as shown in the schema.
Left to right shows who owns which activities.
Set-up
-
This data is managed in a neo4j database on a free service tier.
-
It was created by importing 7 spreadsheets.
-
Now it can manage the portfolio, updating as necessary.
The pattern / schema comes from the data and the management style of the portfolio. I find it much easier to see the relationships within the portfolio, than to consult the various spreadsheets - each of which covers some but not all of the properties. For example, there is a spreadsheet for Investments and a spreadsheet for Contracts. I prefer to see this information all at once as a graph.
There are other graph databases that can provide a similar service, but I find Neo4j has a straightforward an intuitive way of writing a query to generate the graph of interest.
Flexibility
There is no fixed neo4j pattern or mandated data model.
So the pattern can be updated as the portfolio management matures, whilst reflecting the reality of what records have been kept.
Or the portfolio can be managed where it is now, and periodically imported into neo4j to gain insight. It is quick to implement as there is no permanent project-data-model to sign-off.
Implement what you have, manage the portfolio, and iterate the structure as the organisation learns what it wants.
Other information can be stored as properties
Neo4j allows the user to add properties to both nodes and relationships. The following four key node types have additional property data attached to each instance, as follows:
| Investment | Project | Activity | Metric |
|---|---|---|---|
| Investment_type | Updated_Date | planned_Costs | Metric_results |
| Changes_to_Baseline | name | Actual_duration | ID |
| Identifier | Planned_Cost | output_type | Description |
| name | Project_delay | Start_Date_Planned | Measurement_category |
| Last_Baseline | Start_days_after_2000 | No_Child_Activity | |
| Performance_Gap | Cost_Variance | name | |
| Summary | Id | description | |
| Business_Case | Planned_Duration | Actual_start_delay | |
| Enhancement_spend_$m | Id | ||
| Evaluation_by_CIO | status |
Data source
Thanks for the data to ProjectingSuccess from last year’s excellent Project Hack, and Oxford Business School for this data on IT projects managed by the US Government, 2013-2018. Please respect the data which has been provided by the business school for research and development purposes only.
There are several more bureaus and investments which we have not brought into the database at this stage. Some rows were dropped where they did not have complete information.
Further information
I would welcome any thoughts on what other questions I should be asking, and the challenges you see in using graph databases for their own portfolios.
If you struggle to set up your own graph database, or cannot see how to get started with this using this particular dataset then do let me know.
The simplest way to play with this portfolio is to start with a subset of the graph, just the FDA department projects. Create a neo4j sandbox, or download Neo4j desktop, and just paste in this code into the query box at the top. This will create a graph database for the FDA.
This project example is held as Example 0 in this repository. Please be aware this is an active project /repository so it will continue to change.
The latest version of this summary can be found here
Further more general information on portfolio management approaches here
Lawrence Rowland Sept 2020