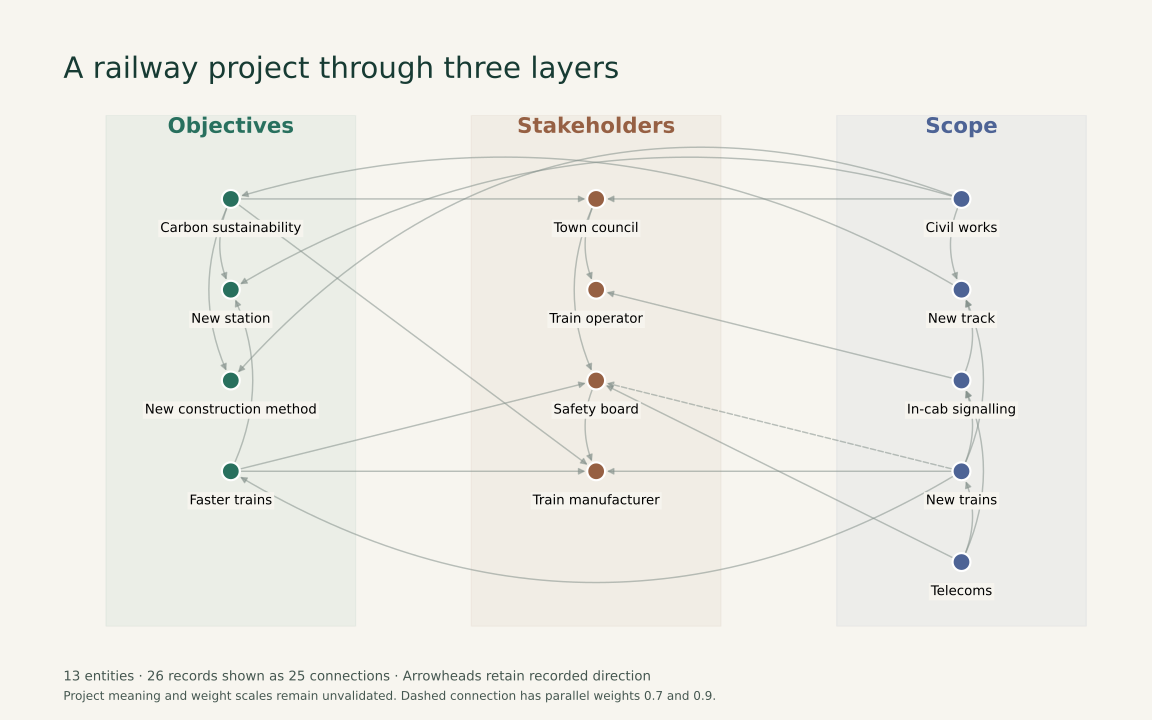
What changed when we ran the railway model?
The original lists were reconstructed in py3plex 2.0.93 as 14 entities and 27 directed records. Correcting one manufacturer spelling and one exactly repeated row gives 13 entities and 26 directed records, shown as 25 connections. All 27 source rows remain traceable. The two different new-trains/safety-board weights remain separate.
Three computed observations
- The new station is an endpoint, not a starting point. Its incoming neighbours are civil works, carbon sustainability and faster trains. It has 0 outgoing connections. An undirected neighbourhood query returns all three, but those are not supported outward routes. Source rows:
inter_layer_edges-08,objectives-01,objectives-03. - A recorded route crosses all three layers. New track → carbon sustainability → town council is an unweighted 2-hop route. There is no directed return route. Ignoring direction makes the return possible in 2 hops. This difference is produced by the projection; it supplies no extra evidence about authority, causation or delivery. Source rows:
inter_layer_edges-07,inter_layer_edges-01. - One line can stand for two unresolved records. New trains → safety board has 2 records, carrying 0.7 and 0.9. The picture bundles them as one connection, while the inspector and runtime retain both. Selecting or averaging a weight would add an unsupported judgement. Source rows:
inter_layer_edges-10,inter_layer_edges-15.
These queries were computed from the running graph and checked independently against adjacency sets and row values extracted from the notebook. The two-hop result was also checked by direct expansion of those source lists. See the complete machine-readable findings and 27 original rows.
What “flat” does and does not mean
The interactive flat drawing changes placement only. It keeps the same entities, layer labels, arrows, original rows and inspector. It is a comparison of visual organisation, not a different network and not evidence that layering changes an algorithm's answer.
The simple directed analysis really is a projection: parallel records become one ordered endpoint pair, reducing 26 records to 25 connections. The undirected neighbourhood projection additionally forgets orientation. It retains 25 connections here because this example has no reciprocal pair, but its permitted routes differ, as the new-station and town-council queries show. Neither projection uses the source weights.
Method and limits
This is a heterogeneous multilayer network: each stakeholder, objective or scope item belongs to exactly one layer. It is not a multiplex containing replicas of the same entity in every layer. No automatic identity-coupling edges are added. A schema checks each relation's source and target layers and preserves the recorded orientation. Relation names classify the endpoint layers; the notebook does not establish their business meaning.
The original 2022 constructor defaulted to a directed graph with parallel edges. The fresh reconstruction explicitly requests that behaviour and checks every endpoint, layer, orientation, weight and repeated row. The corrected graph makes only the declared alias and exact-repeat changes. The original authored notebook code and commentary remain in sources; historical outputs and incidental metadata were removed before publication. The old exploratory notebooks are source material, not a claim that every cell now runs.
There are 13 cross-layer pairs, 12 within-layer pairs, and 1 weakly connected component. The simple directed density is 0.1603 (25 of 156 possible ordered pairs). The simple undirected density is 0.3205 (25 of 78 possible unordered pairs). These are different denominators, not a change in the evidence. Each metric names its projection.
The weights have no established common unit: objective rows include 5, 7 and 10, while other rows use values between 0.1 and 1. They are preserved as source data, never treated as distances, probabilities or comparable strengths. No weighted path, benefit ranking, responsibility allocation or causal conclusion is justified by this run. The result is a reproducible small example for asking which relationships need clarification.
Reproduce
Use Python 3.12 in a new virtual environment, install requirements-lock.txt, then run python project_graph.py and python -m unittest discover -s tests -v. This run used Python 3.12.16, py3plex 2.0.93, NetworkX 3.7 and Matplotlib 3.11.2. The runtime receipt records the successful graph checks and package versions. Release verification and source hashes are in provenance.