The library
Project states & relationships
What changes, and what connects to what?
Connect tasks, states, people and resources. Explore shared project models, process diagrams and the relationships behind a portfolio.
Examples, diagrams and reading sit together here. Dates and limitations belong to each piece; an earlier illustration is not a claim of current practice.
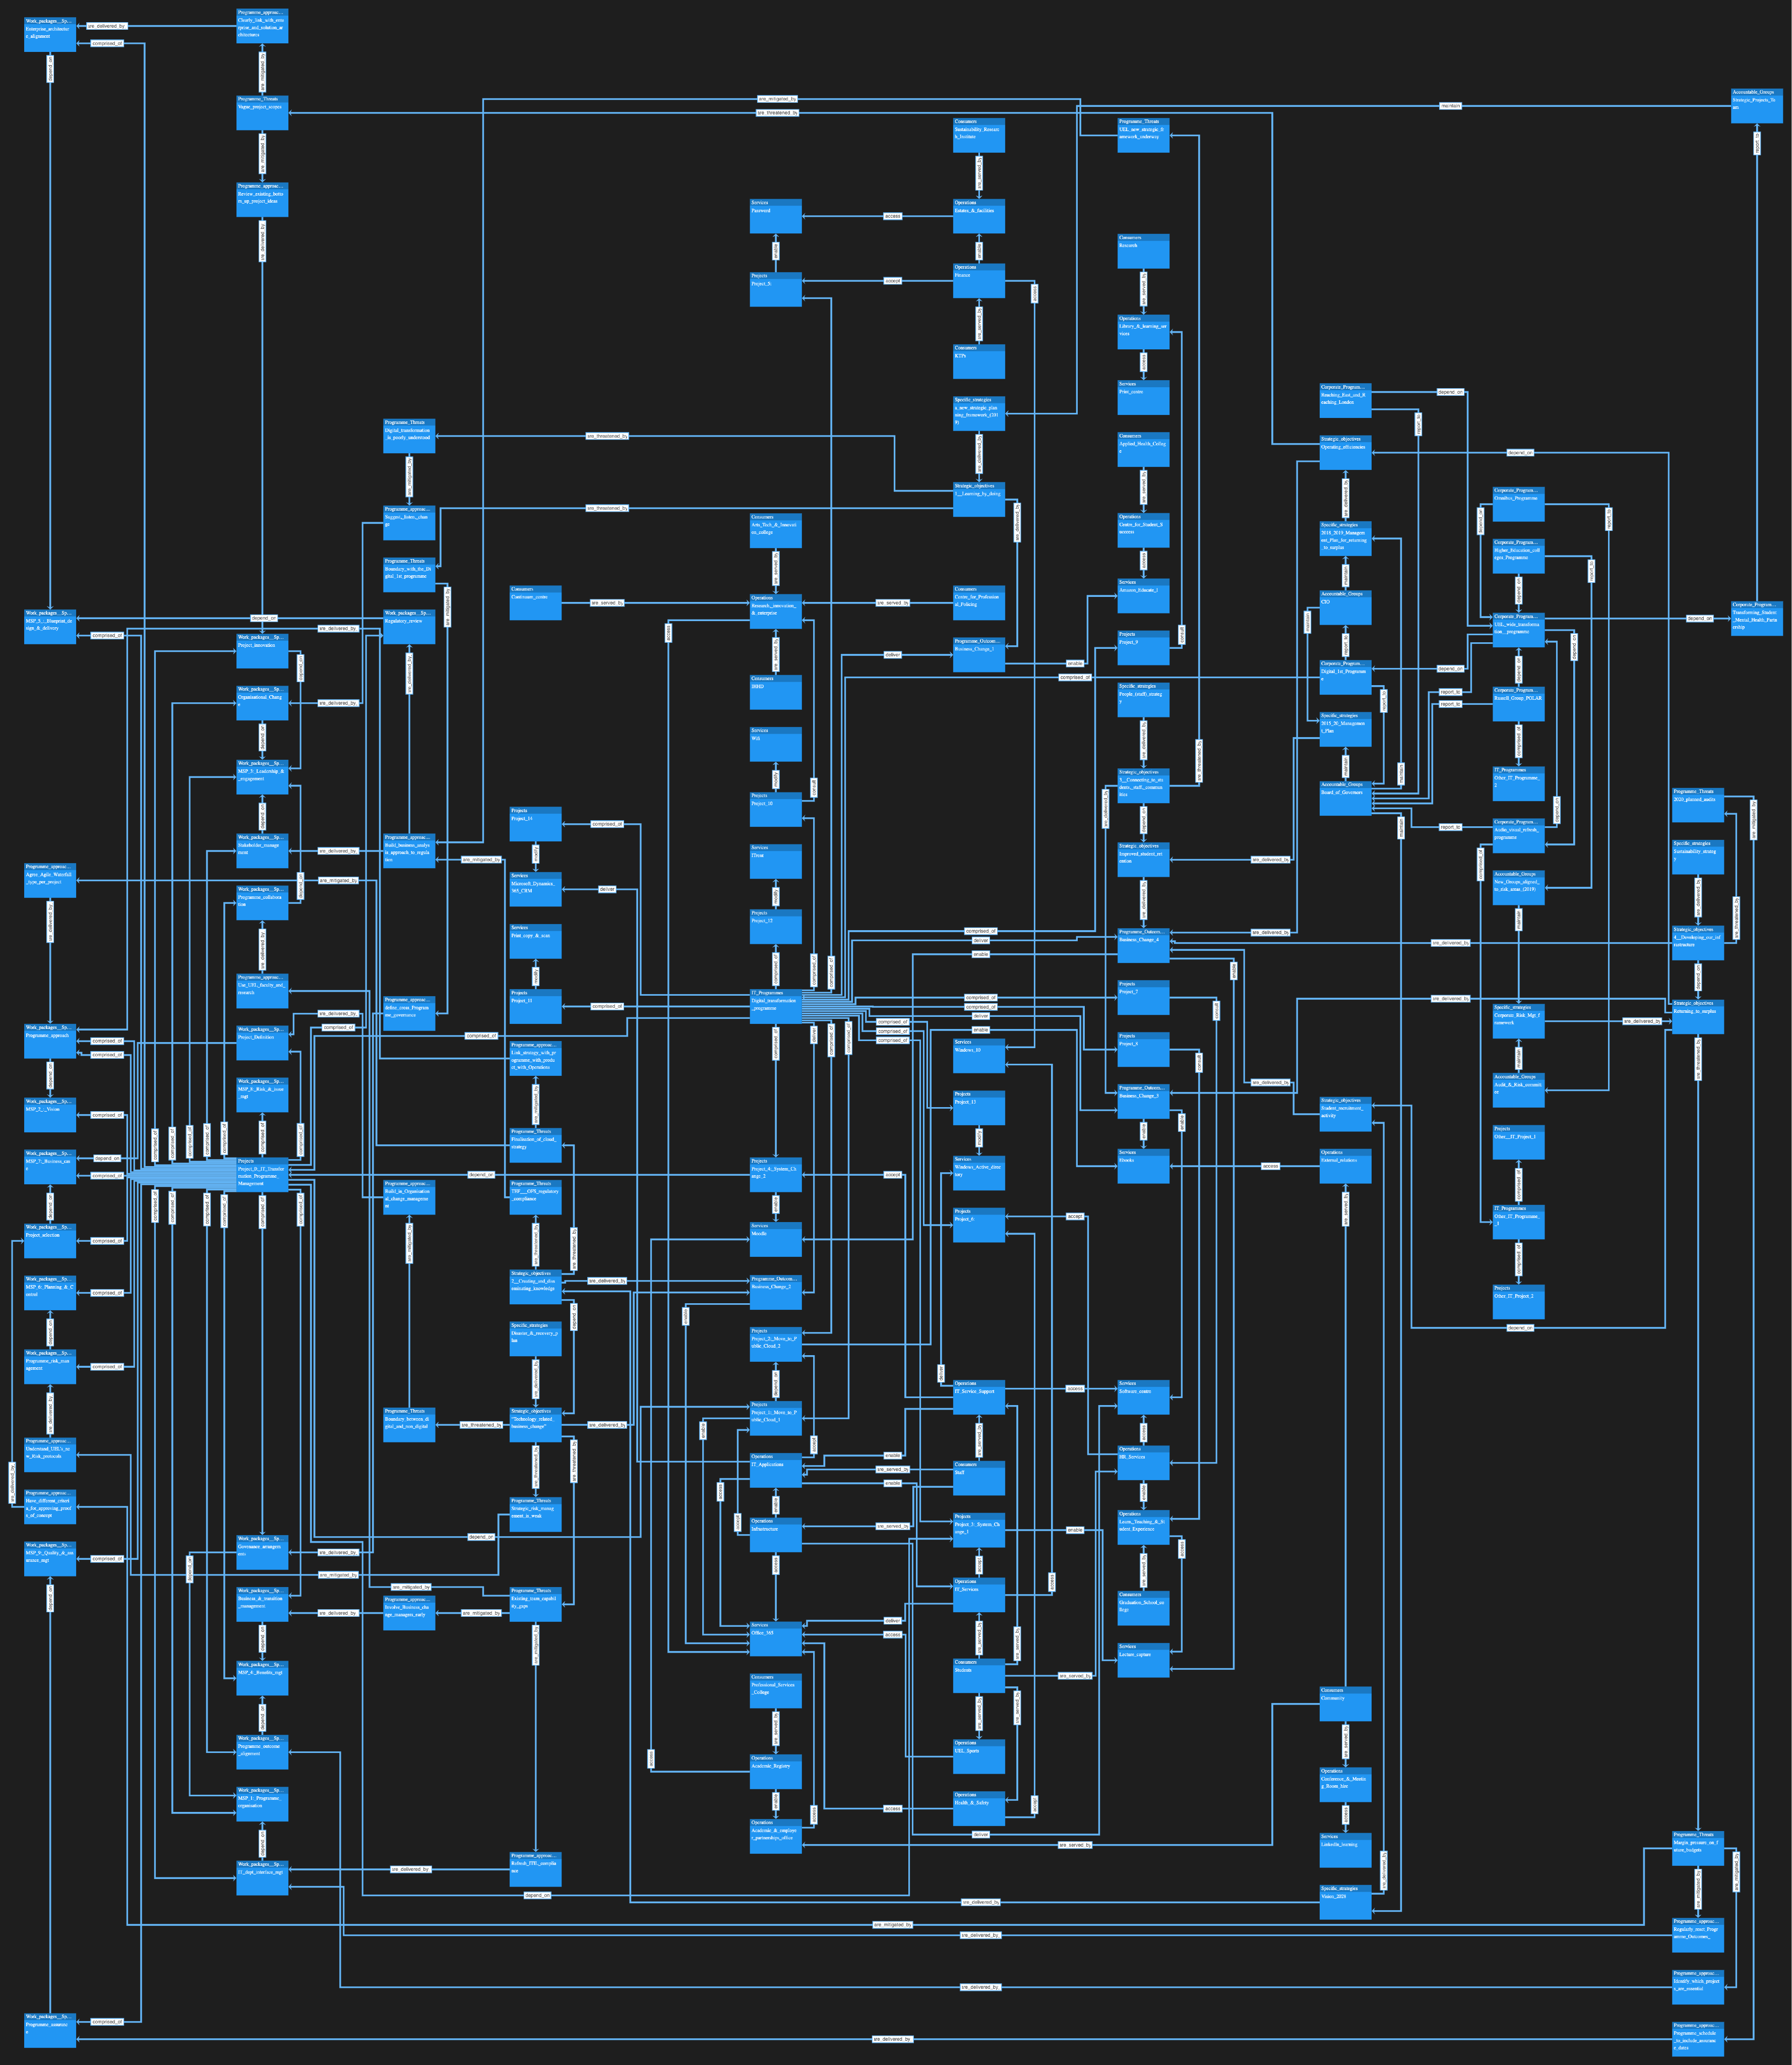
Worked models · Projects, programmes & portfolios
How should the work fit into a shared picture?
Compare tasks, states and resources in one small job; read four directors’ views of one roadmap; or explore programme schemas, portfolio-needs notes and an earlier ontology experiment. The explanations link to their original diagrams and source files.
Interactive example
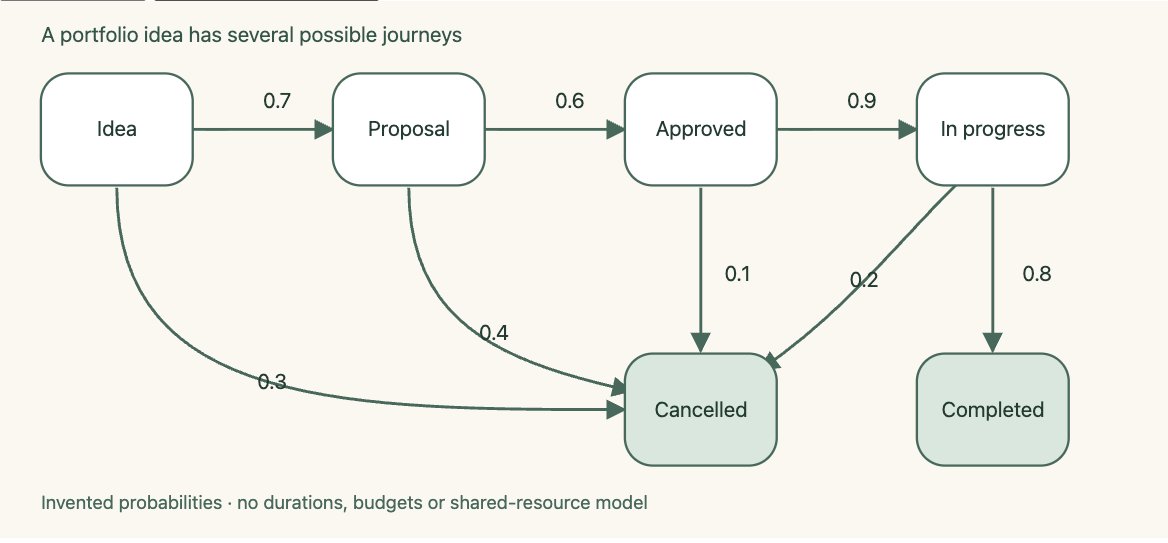
Move a project through a portfolio
Make a bespoke lifecycle visible, with permitted moves and probabilistic runs.
What to try & what it leaves out
Try. Add a project, inspect its permitted next states, then compare one journey with the batch summary.
Limits. An invented transition model; frequencies illustrate supplied probabilities rather than predict a real portfolio.
Earlier example, repaired and reviewed 2 October 2026. This review checks the stated model and interactions; it does not establish usefulness in practice.
GitHub source (may require access)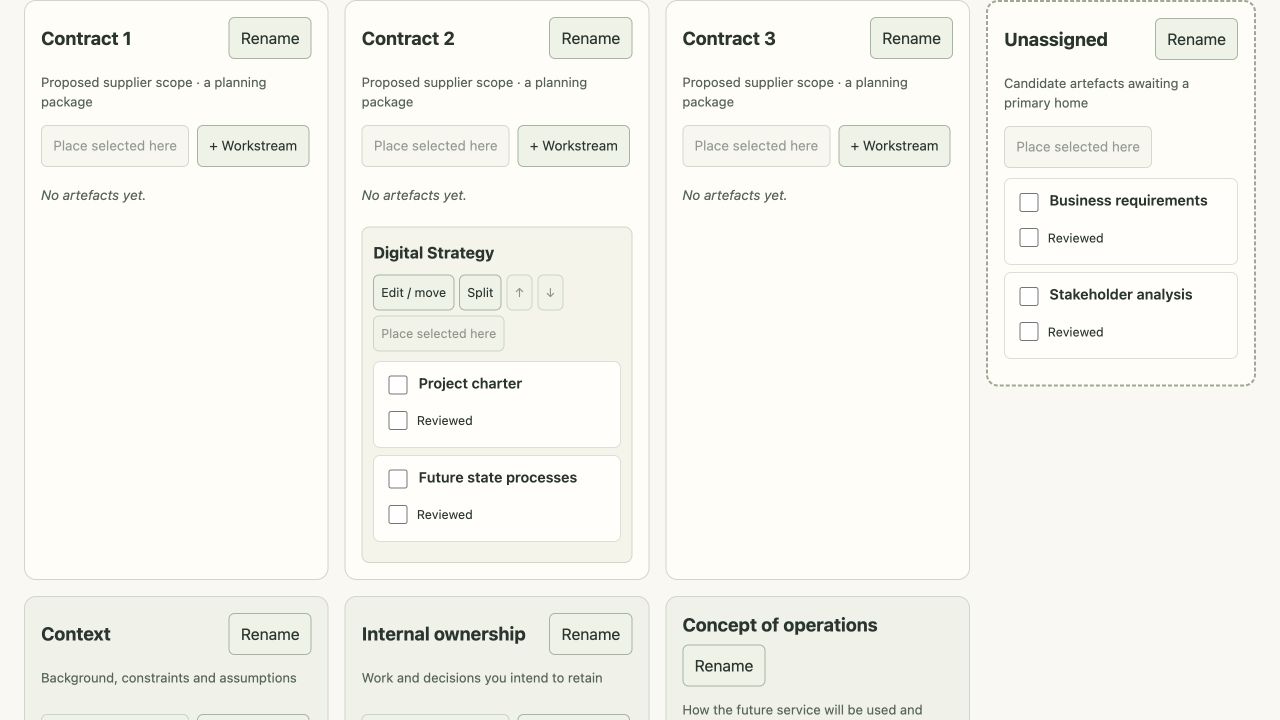
Interactive example
Contract Portfolio Board
Allocate planning artefacts among contracts, workstreams, context, internal work and concepts of operation.
What to try & what it leaves out
Try. Place an unassigned card, move a workstream and split selected cards into another. Export and reload your board.
Limits. A local planning board. Its allocations do not establish legal scope, contractual obligations or acceptance.
Earlier example, repaired and reviewed 2 October 2026. This review checks the stated model and interactions; it does not establish usefulness in practice.
GitHub source (may require access)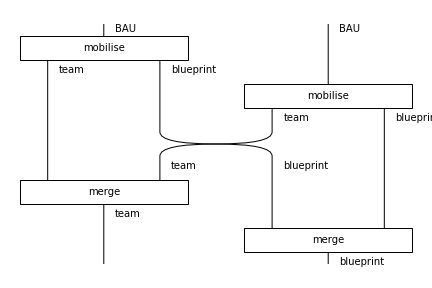
Modelling notebook · DisCoPy · 8 October 2022
How do two mobilisation processes fit together?
Each project produces a team and a blueprint. Follow the wires to see how typed process composition brings like outputs together, and what it leaves for the project manager to decide.
Earlier process illustration · Petri net → WBS
From shed states to a candidate task structure
Switch among three starting token patterns for a toy shed build. Compare the displayed Petri net, transition table, task tree and simple dates.
What this example leaves open
The traversal records each transition at most once across alternative markings. Its combined transition list need not be one executable firing sequence, so the displayed task structure and dates are illustrations, not a verified complete shed plan.
Interactive example
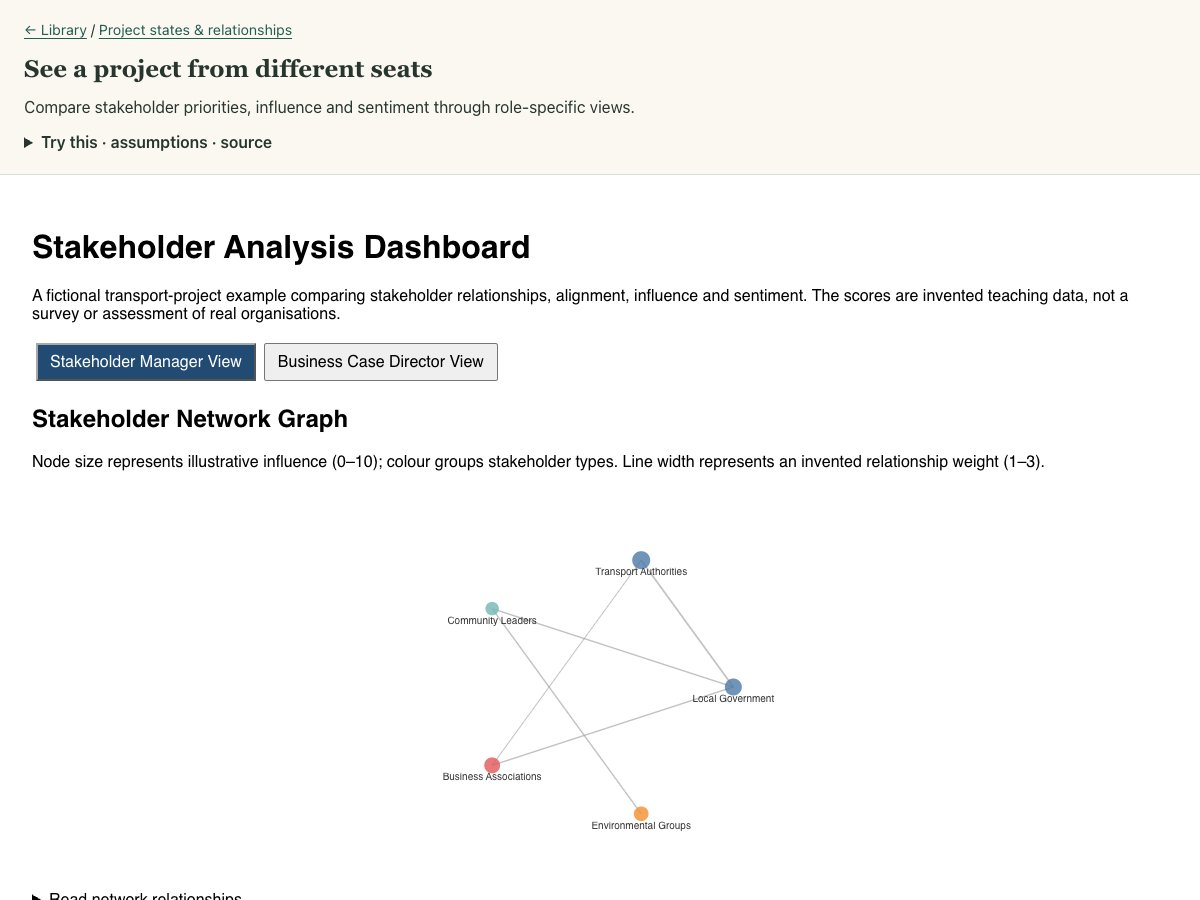
See a project from different seats
Compare stakeholder priorities, influence and sentiment through role-specific views.
What to try & what it leaves out
Try. Switch your role, inspect the stakeholder measures, and compare the charts with the source table.
Limits. Illustrative assessments and relationships, not surveyed evidence or a computed stakeholder strategy.
Earlier example, repaired and reviewed 2 October 2026. This review checks the stated model and interactions; it does not establish usefulness in practice.
GitHub source (may require access)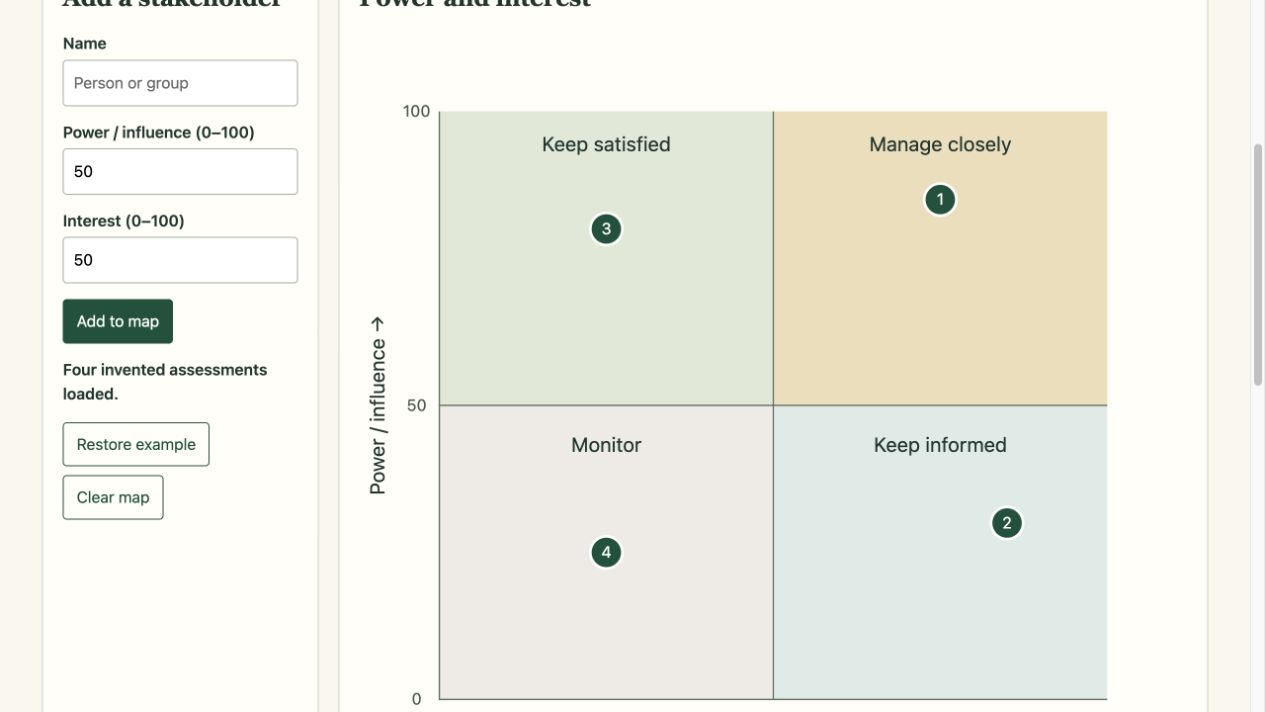
Interactive example
Who needs a different conversation?
Map stakeholder influence and interest, revise your judgements, and inspect the suggested contact approach.
What to try & what it leaves out
Try. Raise Residents’ power from 30 to 70. Add a second stakeholder at the same position and inspect both.
Limits. Supplied judgements with a conventional split at 50. Scores do not measure support, rights or relationships, and low power does not justify exclusion.
Earlier example, repaired and reviewed 2 October 2026. This review checks the stated model and interactions; it does not establish usefulness in practice.
GitHub source (may require access)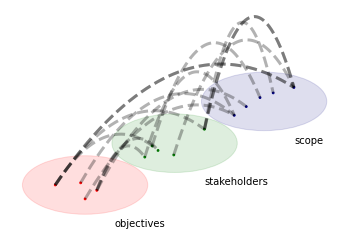
Modelling notebook · Py3Plex · October 2022
How does railway scope connect to people and objectives?
A new station, faster trains and carbon ambitions meet track, signalling and the organisations involved. Read three layers together, then see what an objective-only view leaves out.
Interactive example
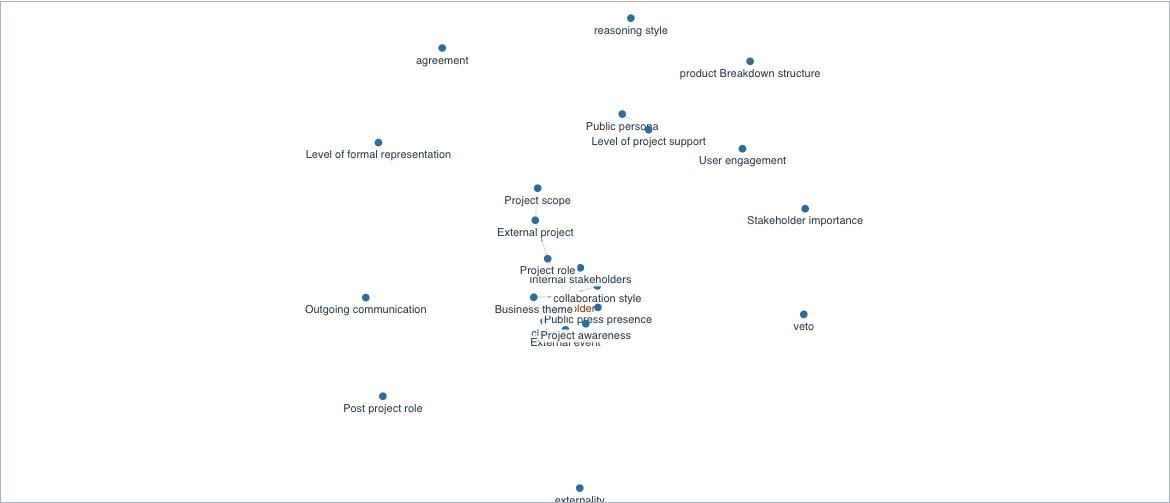
Read a stakeholder concept schema
Explore the concepts and partial relationships in a draft stakeholder model.
What to try & what it leaves out
Try. Select a concept, read its incoming and outgoing relationships, then inspect concepts with no links yet.
Limits. A partial concept schema, not a measured social network. Unconnected concepts are visible gaps; positions and colours do not measure influence.
Earlier example, repaired and reviewed 2 October 2026. This review checks the stated model and interactions; it does not establish usefulness in practice.
GitHub source (may require access)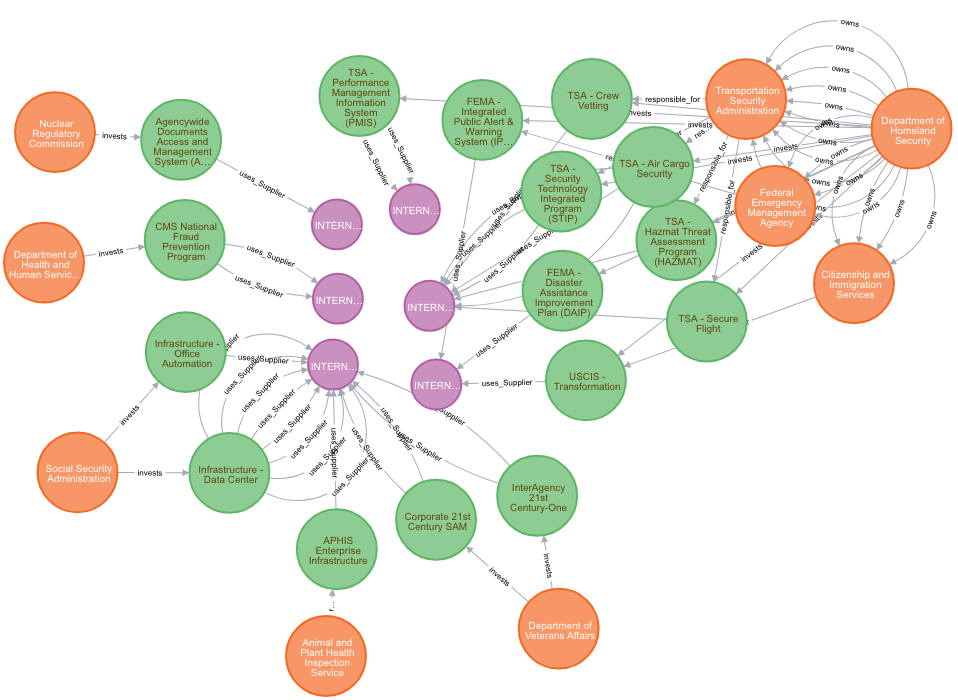
Historical case study · September 2020
Following questions through a US IT portfolio
Original pictures connect suppliers, delivery work and measures, with dated reading guidance. Follow a management question through the connected records, then check what was counted.
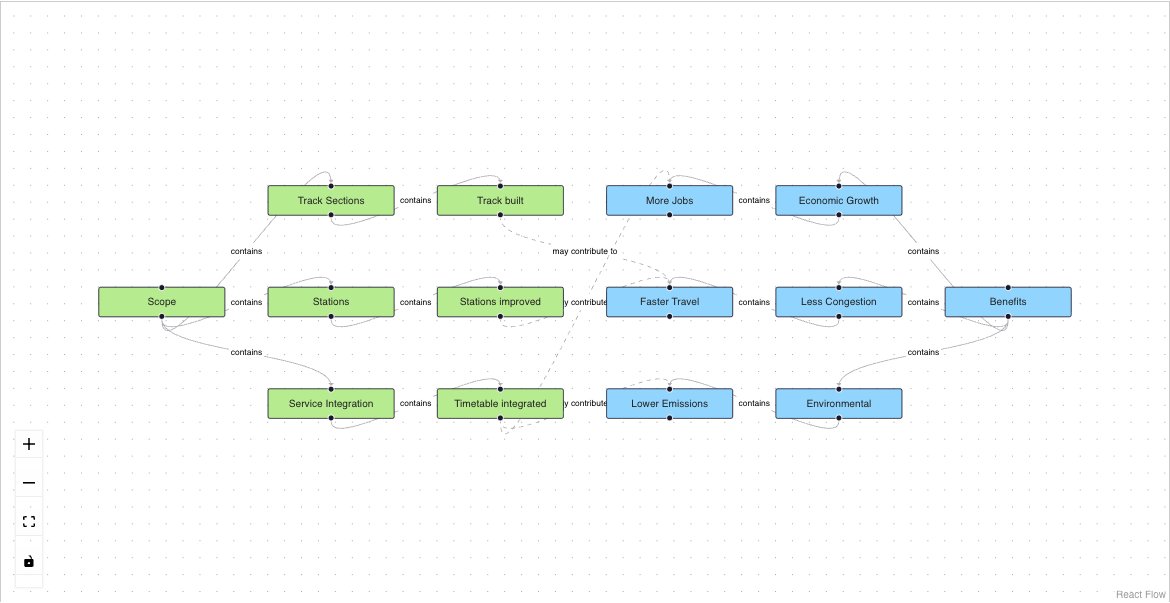
Interactive example
Trace outputs towards benefits
Explore an illustrative East West Rail scope-to-benefit tree.
What to try & what it leaves out
Try. Select nodes and follow the links from outputs through outcomes to benefits. Move nodes to make a relationship easier to read.
Limits. A teaching example inspired by the railway, not an approved scope or evidence that benefits will occur.
Earlier example, repaired and reviewed 2 October 2026. This review checks the stated model and interactions; it does not establish usefulness in practice.
GitHub source (may require access)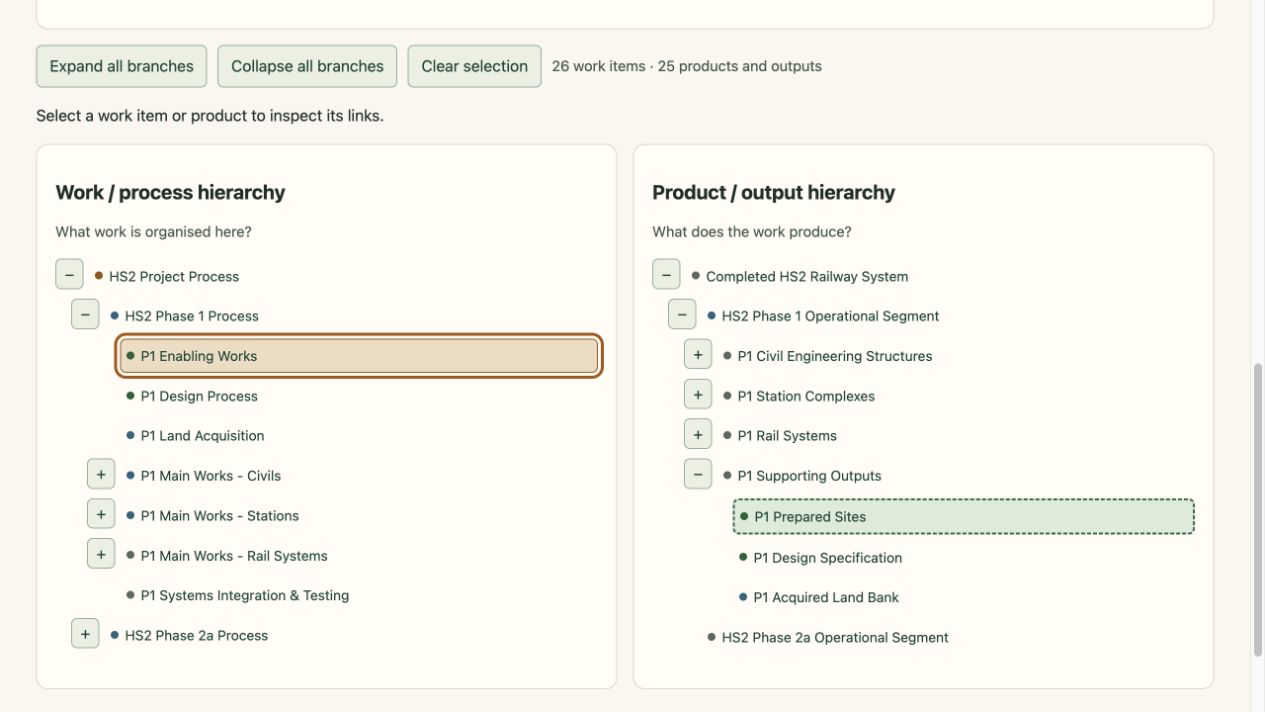
Interactive example
Follow work into products
Explore the same illustrative railway through its process and deliverable hierarchies and their mappings.
What to try & what it leaves out
Try. Expand the trees and select Old Oak Common foundations on the work side. Follow its distinct product, then change phase to compare the supplied metrics.
Limits. Unverified legacy HS2 teaching inputs with no reliable reporting date. The left tree is a process hierarchy, not a standards-conformant WBS; metrics are supplied separately, not calculated roll-ups.
Earlier example, repaired and reviewed 2 October 2026. This review checks the stated model and interactions; it does not establish usefulness in practice.
GitHub source (may require access)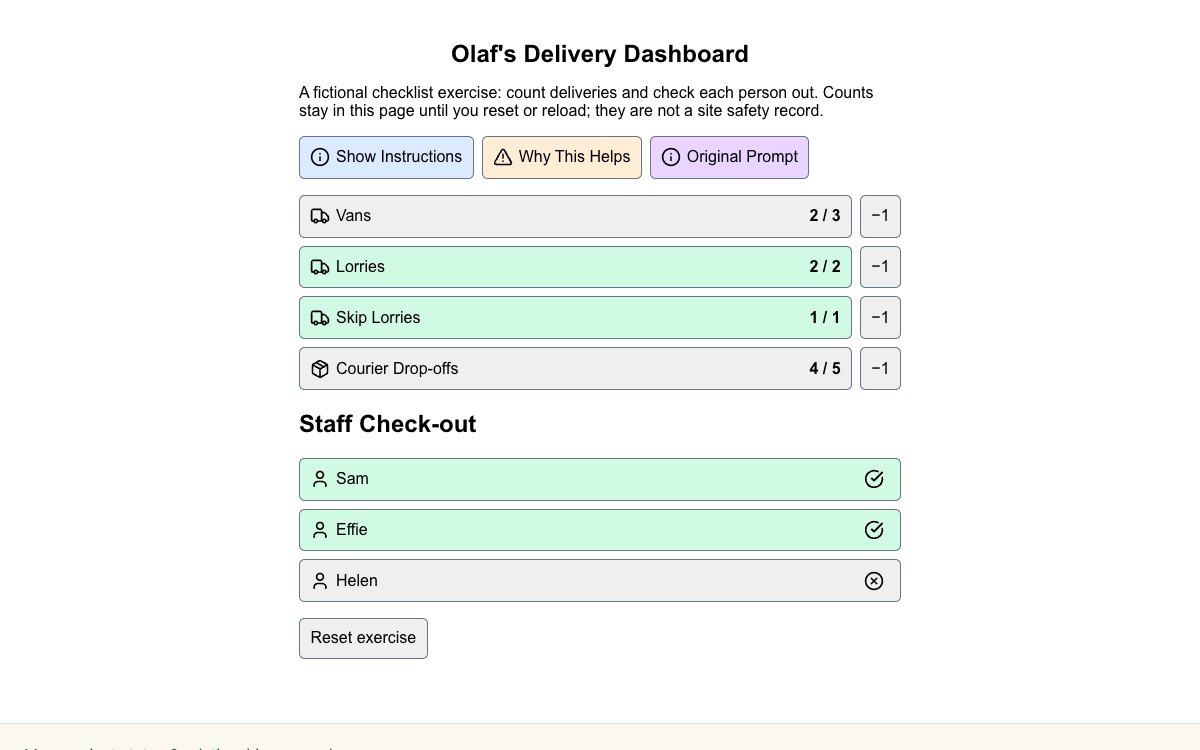
Interactive example
Olaf’s afternoon deliveries
Turn a small request into visible counts and individual confirmations.
What to try & what it leaves out
Try. Count the deliveries, correct a count, and check each person out to complete the fictional checklist.
Limits. Page-local state only. Completing a checklist cannot establish that a real site is safe to close.
Earlier example, repaired and reviewed 2 October 2026. This review checks the stated model and interactions; it does not establish usefulness in practice.
GitHub source (may require access)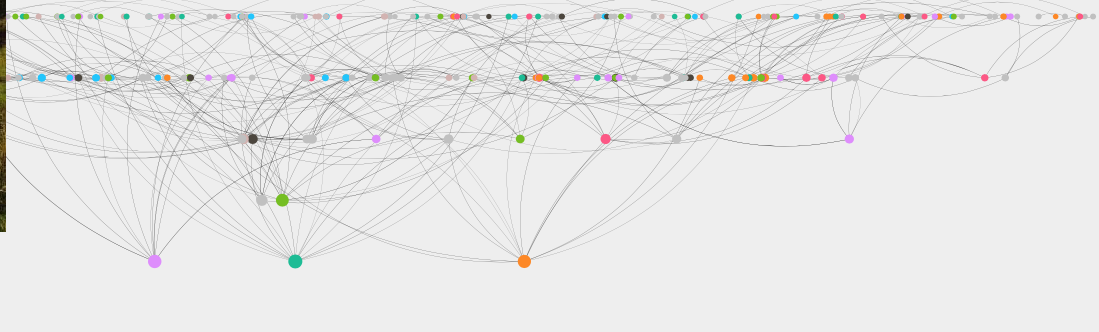
Earlier graph collection
Graphs & connections
Explore the relationships in earlier project models, strategies and methods. Three pictured routes lead into a strategy graph, an operating-model graph and a machine-learning roadmap.
Historical article ·
Data models for project portfolios
Using graph databases to maintain and visualise a project portfolio.

Source-led ontology explorer
Social Debt
The code is ready. The team is waiting. Read a paper’s ontology through a software-team situation.
What this example leaves open
Fictional team situations introduce a projection of the public ontology. The explorer uses the paper’s abstract and deposited ontology; it does not assess the full study or validate the model.
Interactive example
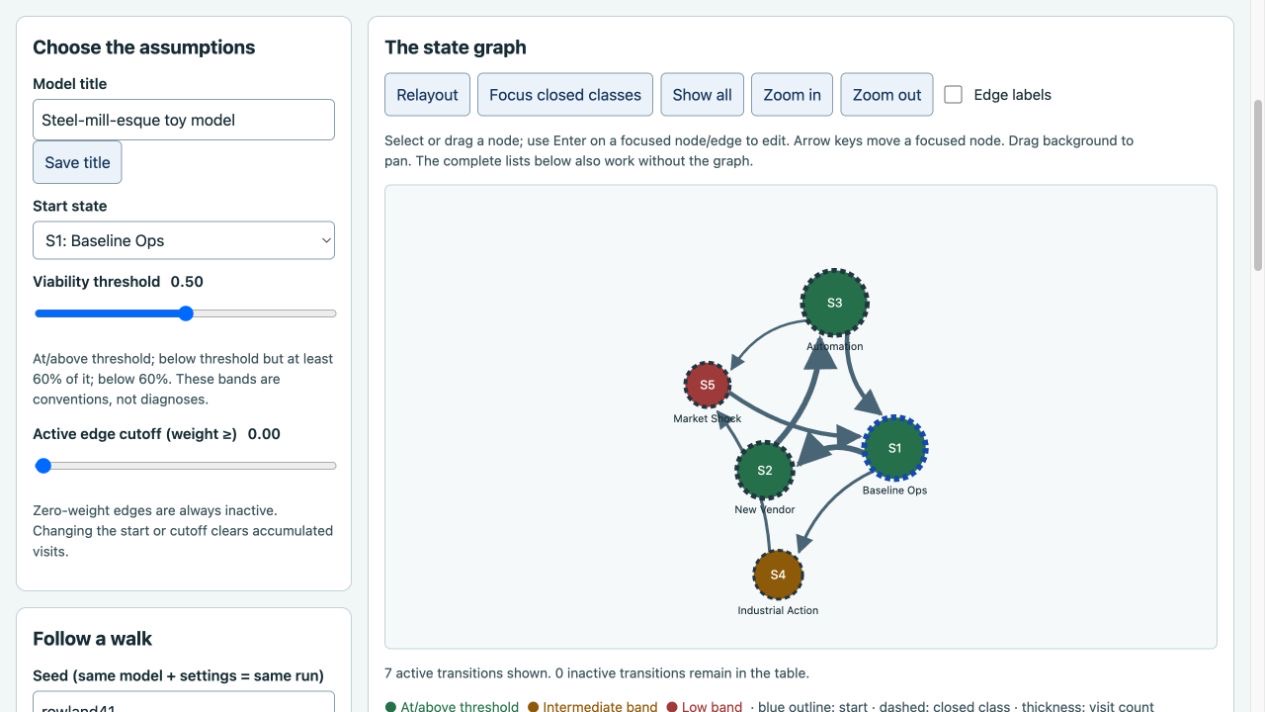
Explore project states and possible traps
Edit a fictional state graph, inspect closed classes and compare seeded weighted walks.
What to try & what it leaves out
Try. Change a transition weight or cutoff, run the walk, and inspect what counts as a trap.
Limits. Supplied relative weights and viability bands are model assumptions, not measured project probabilities or a formal viability kernel.
Earlier example, repaired and reviewed 3 October 2026. This review checks the stated model and interactions; it does not establish usefulness in practice.
GitHub source (may require access)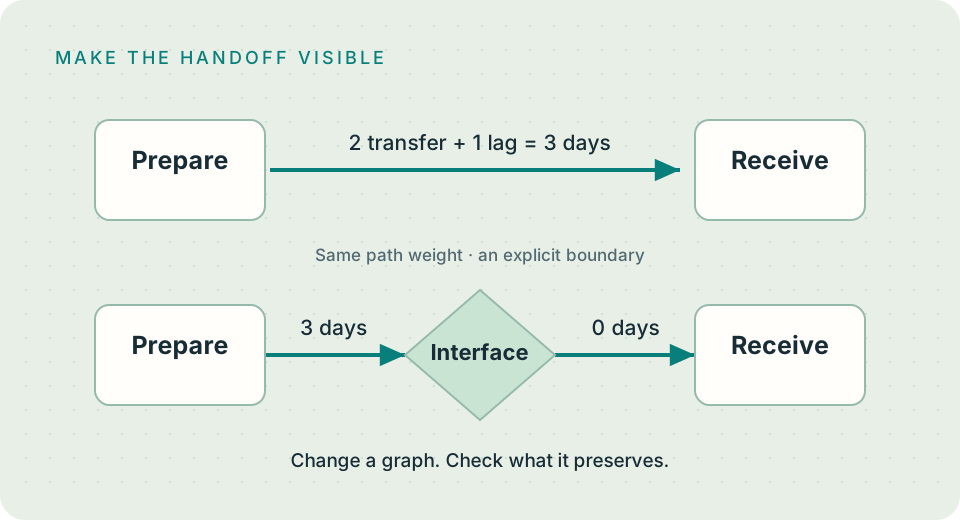
Interactive example
Inspect what a graph change preserves
Change a dependency model, compare grouped views and interface transformations, and inspect what each representation keeps or loses.
What to try & what it leaves out
Try. Insert interfaces along separate edges, then contrast a shared interface and inspect the added dependencies or cycle.
Limits. A supplied dependency model and bounded transformation checks; not a general fibration construction, resource scheduler or verified planning-system integration.
Earlier example, repaired and reviewed 3 October 2026. This review checks the stated model and interactions; it does not establish usefulness in practice.
GitHub source (may require access)