The library
Delivery dynamics & feedback
How does the project change as work happens?
Explore dependency loops, learning, rework, reviews and site occupancy through deliberately small models.
Examples, diagrams and reading sit together here. Dates and limitations belong to each piece; an earlier illustration is not a claim of current practice.
Interactive example
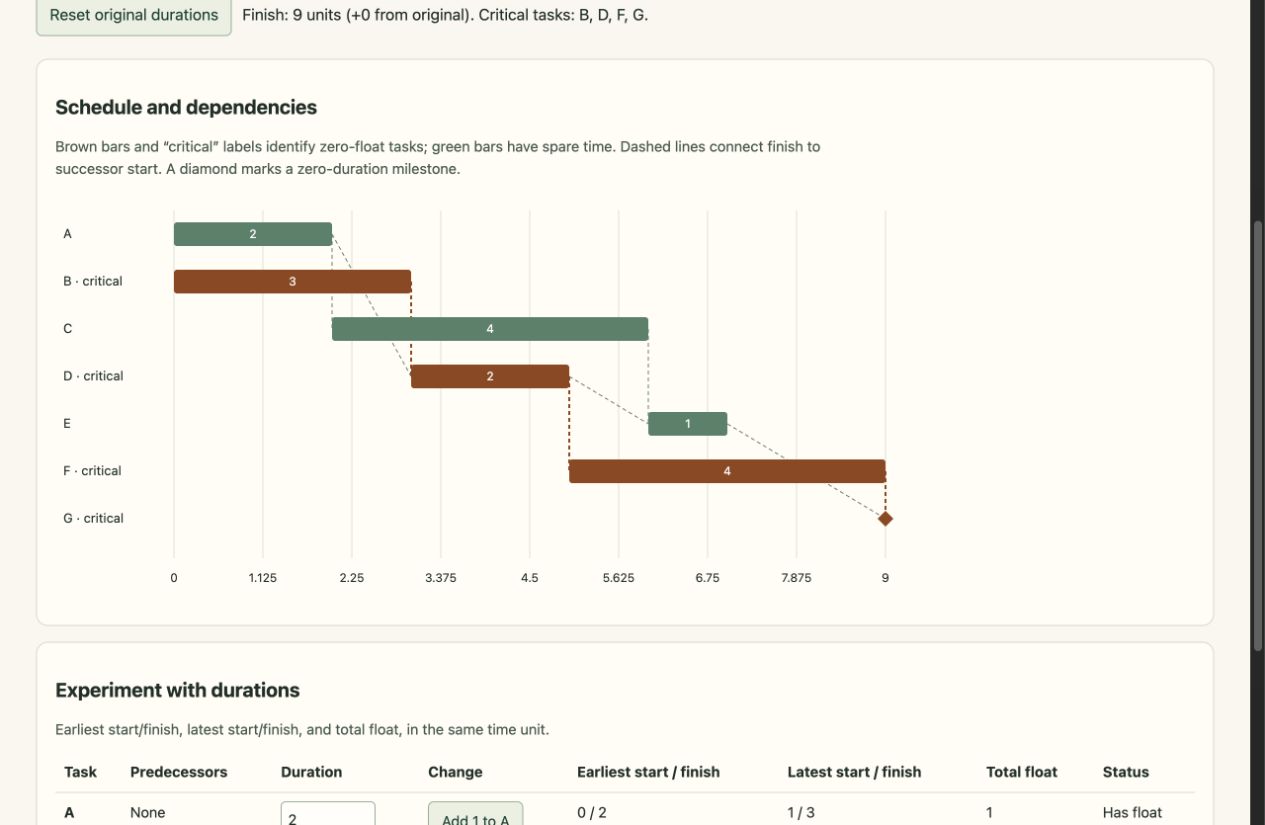
Find the delay that moves the finish
Change durations and watch total float, critical routes and project completion respond.
What to try & what it leaves out
Try. Add one unit to A, reset, then add one to B. One uses float; the other moves completion.
Limits. A deterministic finish-to-start network, without calendars, resources, lags, uncertainty or costs.
Earlier example, repaired and reviewed 2 October 2026. This review checks the stated model and interactions; it does not establish usefulness in practice.
GitHub source (may require access)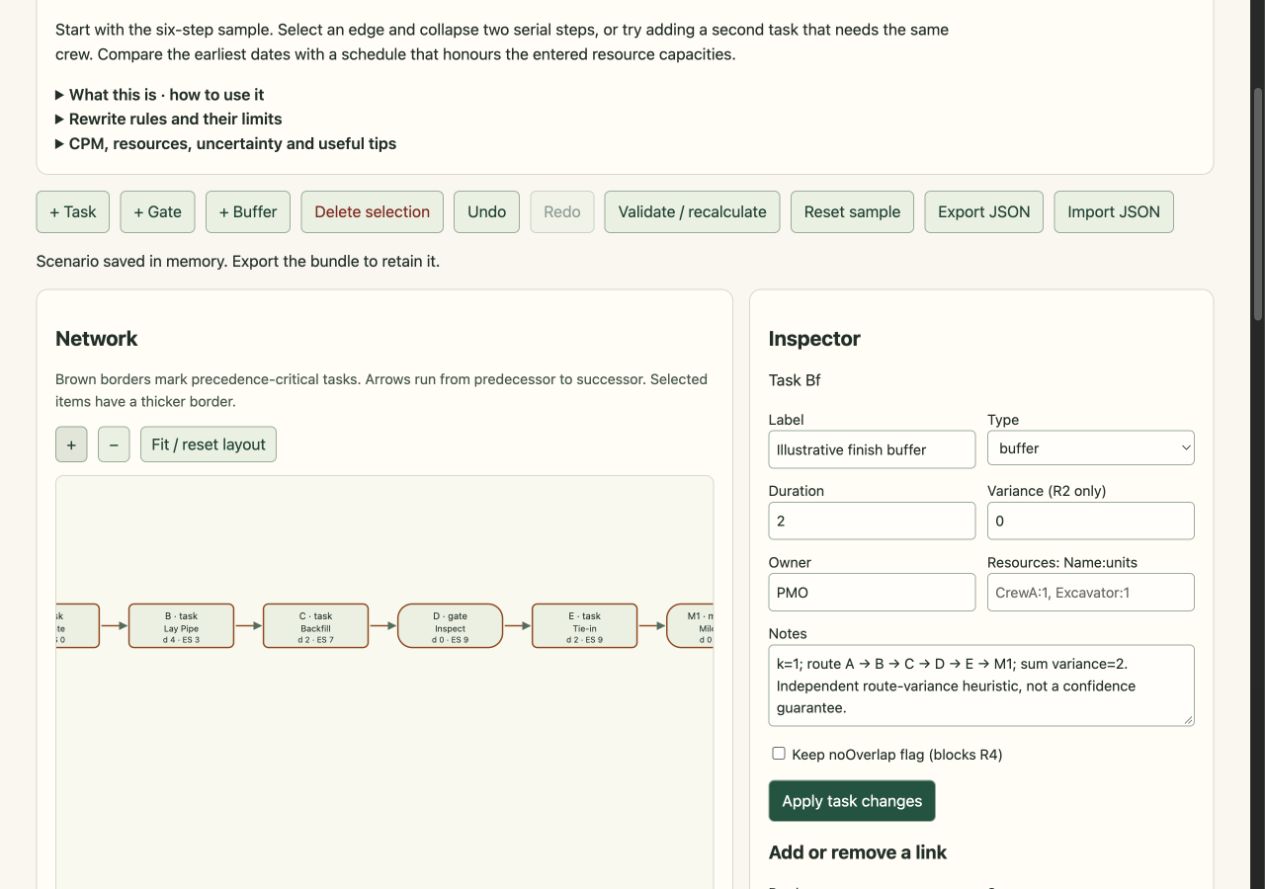
Interactive example
See what a plan rewrite changes
Try graph rewrites and compare dependencies, resource use, duration and uncertainty.
What to try & what it leaves out
Try. Collapse two serial steps and expand them again. Inspect the resource schedule, then test an explicitly assumed dependency change.
Limits. Illustrative activities and heuristic resource scheduling; a graph rewrite is not proof that real work is safely interchangeable.
Earlier example, repaired and reviewed 2 October 2026. This review checks the stated model and interactions; it does not establish usefulness in practice.
GitHub source (may require access)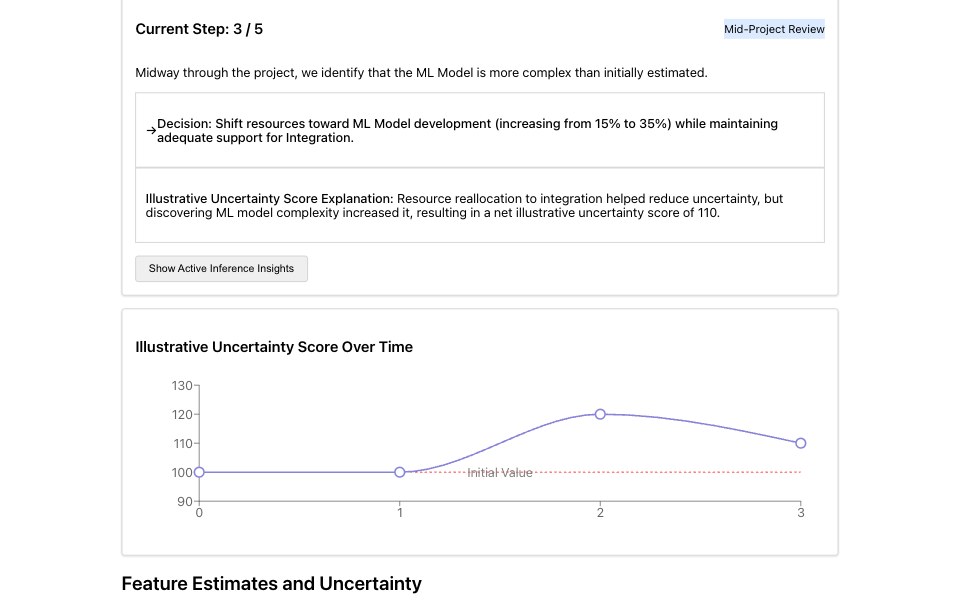
Interactive example
A project review changes the next move
Walk through a scripted project narrative using prediction error and active-inference language as an analogy.
What to try & what it leaves out
Try. Advance through the reviews and compare the beliefs, progress, recorded decisions and later outcomes.
Limits. Scripted teaching values, not variational or expected free-energy calculations, inferred policies or a validated Active Inference model.
Earlier example, repaired and reviewed 2 October 2026. This review checks the stated model and interactions; it does not establish usefulness in practice.
GitHub source (may require access)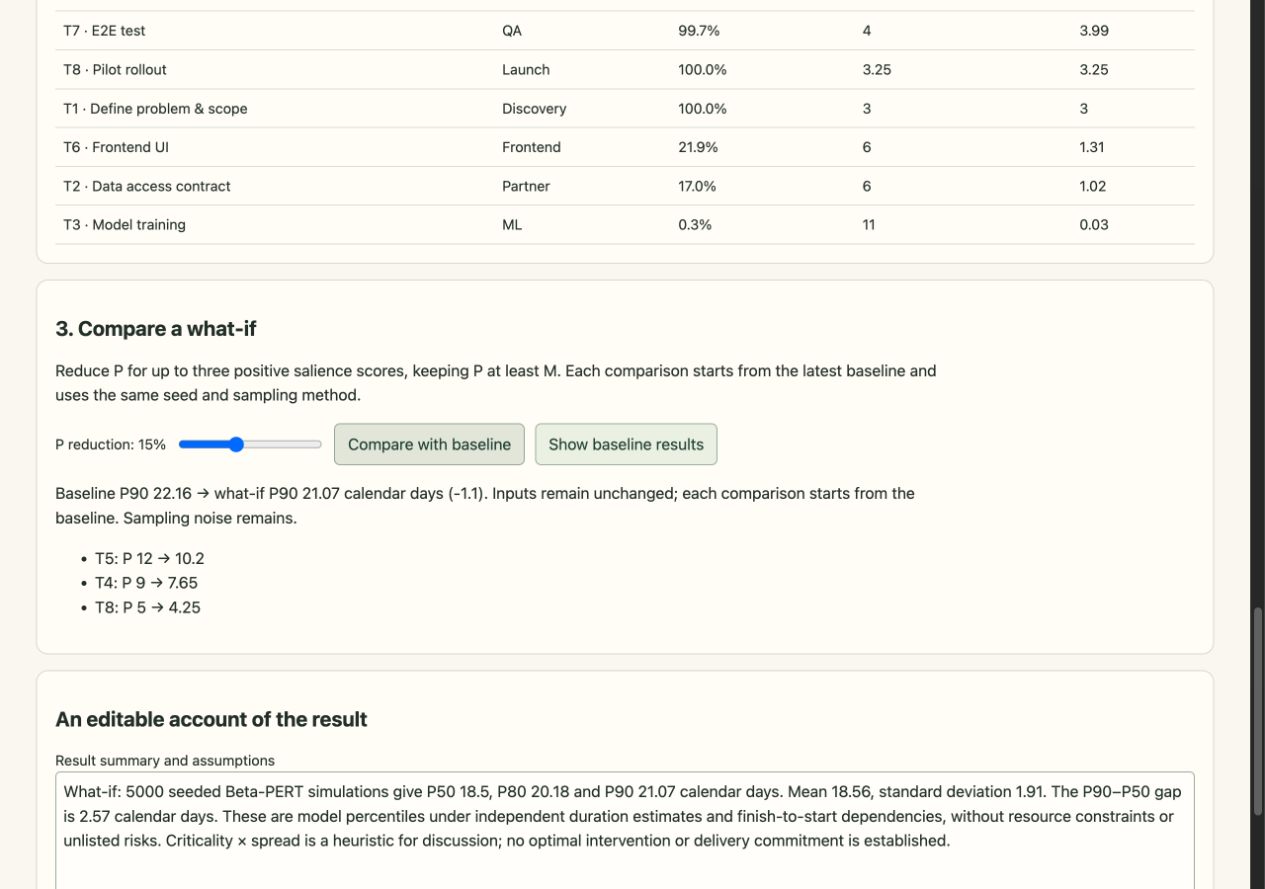
Interactive example
Explore the assumptions behind a delivery date
Build a small schedule, sample duration uncertainty and inspect completion percentiles and activity criticality.
What to try & what it leaves out
Try. Change an activity’s range or distribution assumption, rerun the simulation and compare the distribution with the baseline.
Limits. Probabilities describe the supplied model, not calibrated delivery confidence. Inputs and omitted risks still require judgement.
Earlier example, repaired and reviewed 2 October 2026. This review checks the stated model and interactions; it does not establish usefulness in practice.
GitHub source (may require access)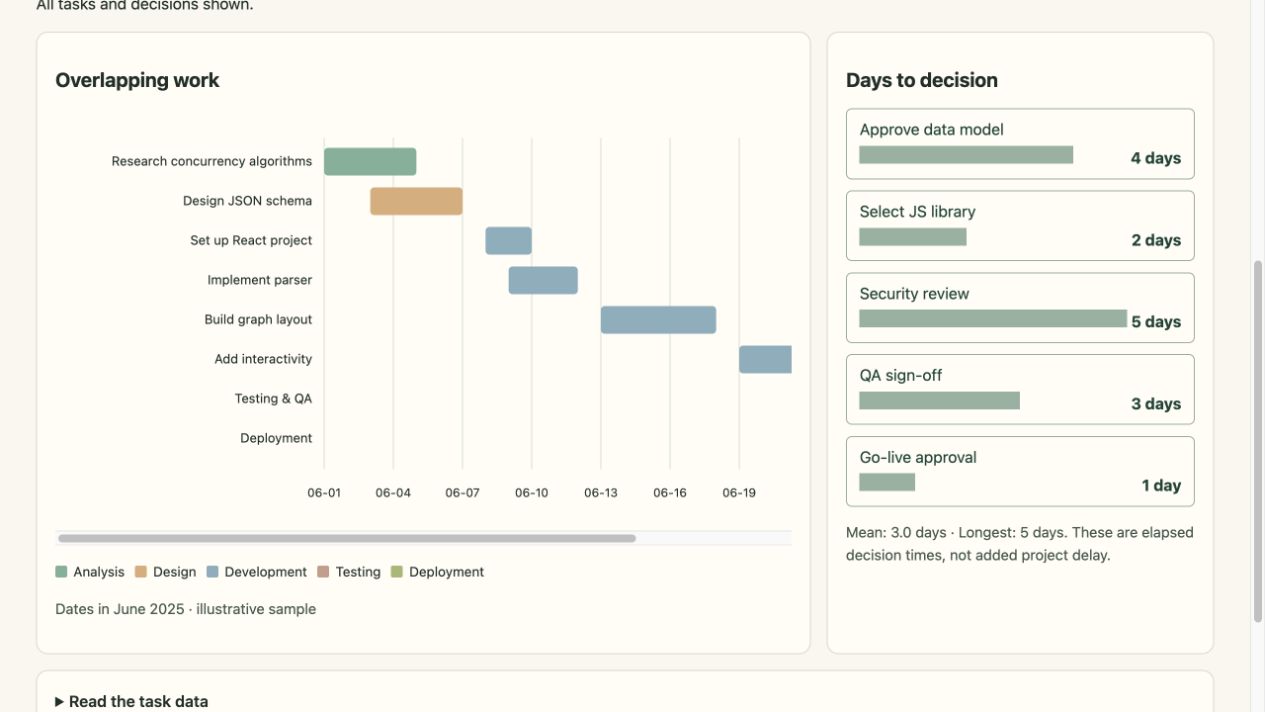
Interactive example
Trace decisions beside overlapping work
Compare task dates and decision response times in an illustrative knowledge-graph project.
What to try & what it leaves out
Try. Select Security review, then select a task bar. Trace the associations across both charts; clear the selection to restore the whole picture.
Limits. Illustrative dates and elapsed decision times. No dated decisions, causal gating rules or dependency network are supplied, so the chart cannot attribute schedule delay or calculate a critical path.
Earlier example, repaired and reviewed 2 October 2026. This review checks the stated model and interactions; it does not establish usefulness in practice.
GitHub source (may require access)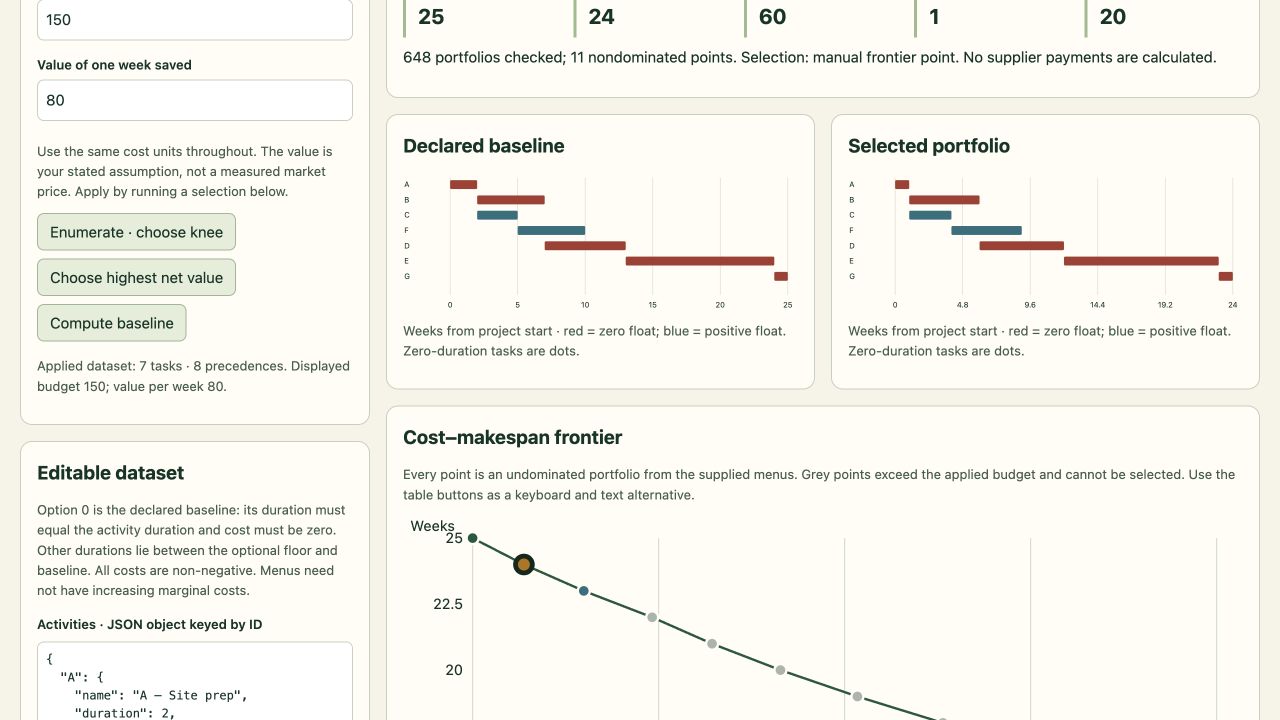
Interactive example
Time Exchange
Explore how discrete task-acceleration choices change project duration, additional cost and the critical path.
What to try & what it leaves out
Try. Set a budget, compare the time–cost frontier and inspect the selected schedule alongside the procurement proposal.
Limits. Exact only within the bounded supplied crash menus and precedence model; excludes shared resource constraints and validated incentive payments.
Earlier example, repaired and reviewed 3 October 2026. This review checks the stated model and interactions; it does not establish usefulness in practice.
GitHub source (may require access)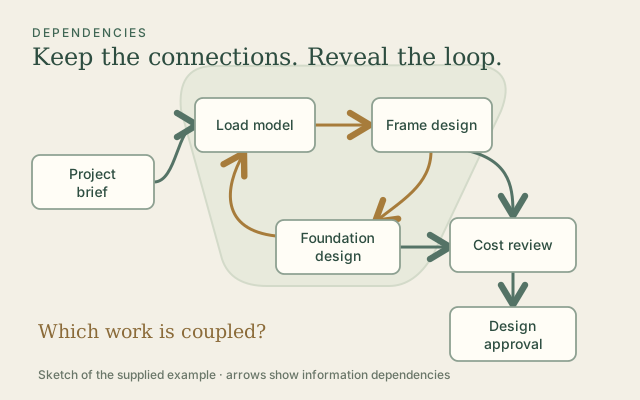
Dependencies & process design
Find the feedback groups.
Which activities depend on one another in a loop? Reorder a six-activity matrix to expose the coupled groups while keeping every dependency.
What to try, assumptions & source
Inputs. Six named activities and editable, binary information dependencies. A mark means that the row activity receives information from the column activity.
Try this. Compare the one-feedback-group and one-way-flow examples. Change a dependency and inspect which activities belong together. The second tab separately illustrates a change of coordinates.
Limits. Dependency groups do not supply a feasible schedule. This example has no durations, resource capacities, coupling strengths or iteration counts; its three rational-matrix examples are not a general solver.
The app explicitly records a revision on 20 September 2026, correcting an earlier comparison from June 2025. This is the app's revision date, not a claim about later use.
Maintained source; original revision recorded · Current model checks and their scope
Interactive example
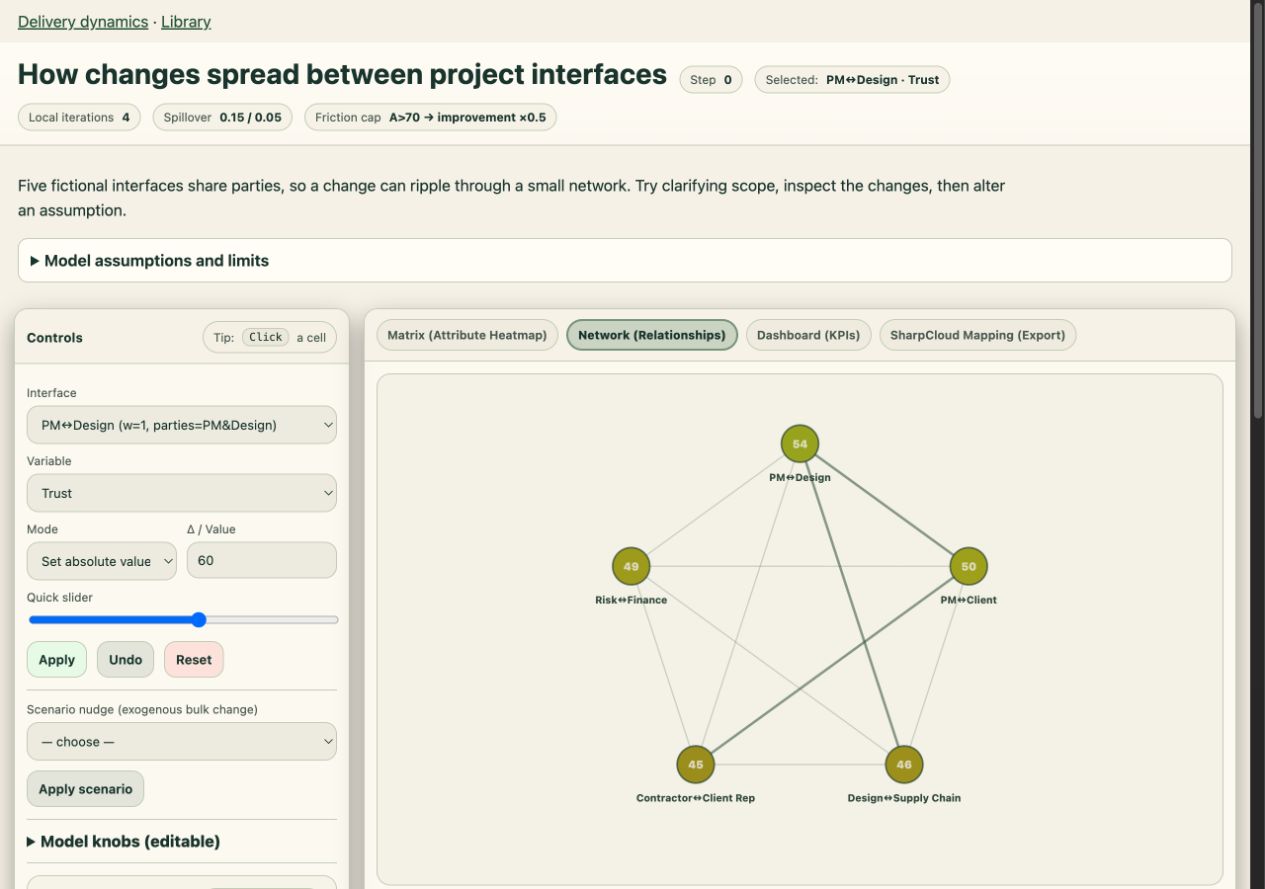
How changes spread between project interfaces
Try explicit feedback and spillover rules across five organisational interfaces.
What to try & what it leaves out
Try. Clarify scope, compare local and neighbouring changes, then alter a coupling assumption and undo the intervention.
Limits. Invented coefficients and a simple equal-weight index illustrate assumptions rather than predict organisational performance.
Earlier example, repaired and reviewed 2 October 2026. This review checks the stated model and interactions; it does not establish usefulness in practice.
GitHub source (may require access)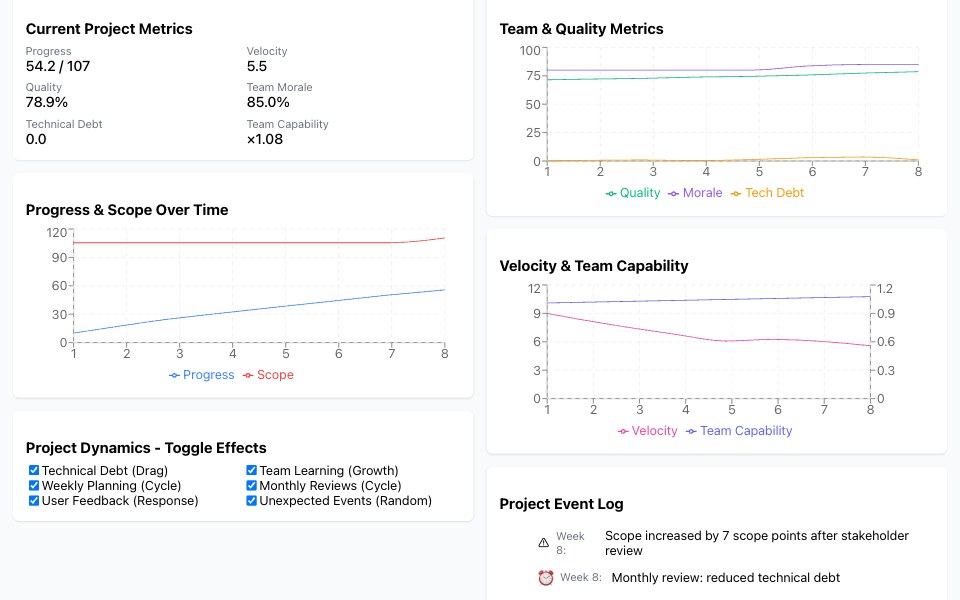
Interactive example
A software team learns and reworks
Explore assumed feedback between delivery, learning, debt, reviews, scope and morale.
What to try & what it leaves out
Try. Advance a week, switch effects off and on, then run and reset. Read the event log alongside the trajectory.
Limits. Invented stochastic rules and coefficients, not calibrated project forecasts. Reset keeps your effect choices.
Earlier example, repaired and reviewed 2 October 2026. This review checks the stated model and interactions; it does not establish usefulness in practice.
GitHub source (may require access)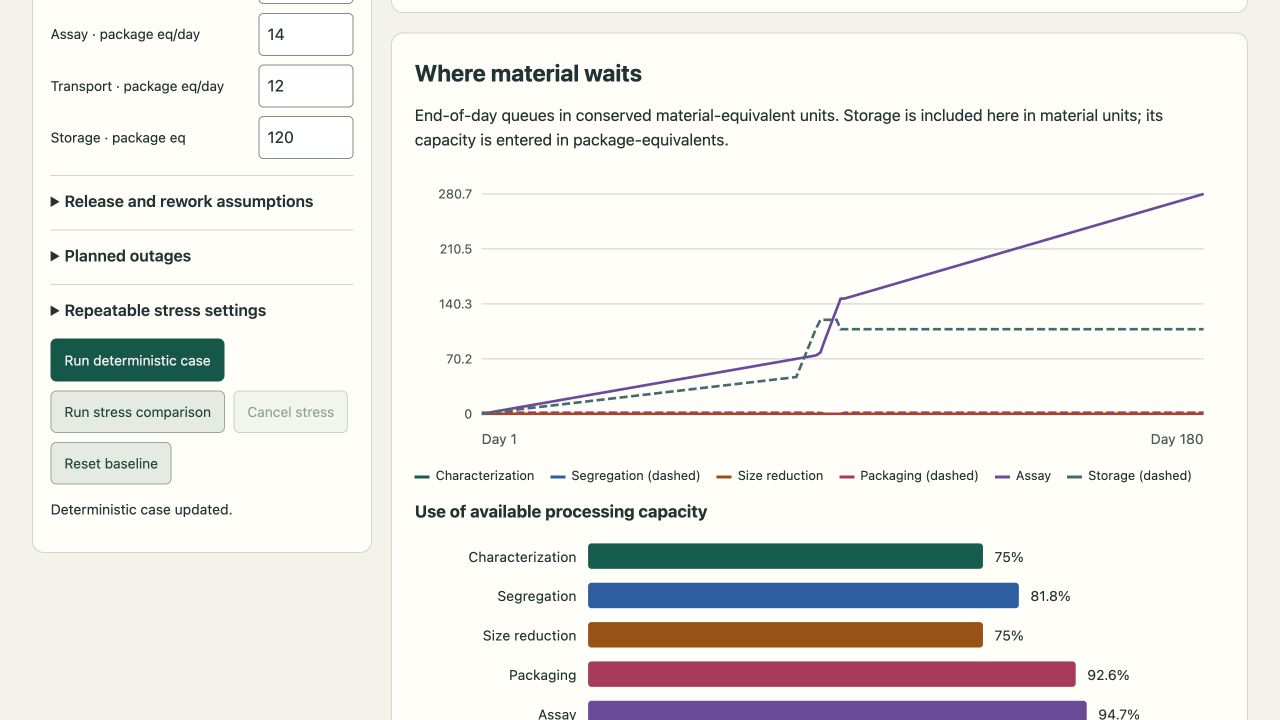
Interactive example
Waste-route capacity
Follow material through treatment, assay, storage and transport; compare capacity, outages, rework and queues.
What to try & what it leaves out
Try. Change storage or transport, then compare a seeded run with a stress ensemble and inspect unfinished inventory.
Limits. A fictional fractional-flow experiment with stated timing and accounting rules. It is not a live digital twin or a physical hazard forecast.
Earlier example, repaired and reviewed 3 October 2026. This review checks the stated model and interactions; it does not establish usefulness in practice.
GitHub source (may require access)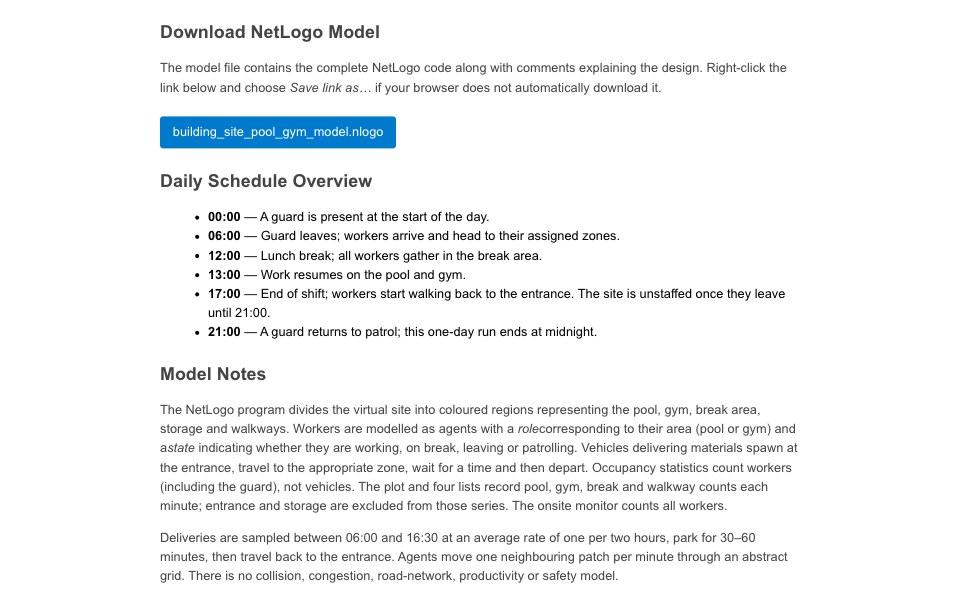
Interactive example
A day on the pool-and-gym site
Read and run a downloadable NetLogo model of workers and deliveries over one day.
What to try & what it leaves out
Try. Download the model, load it into NetLogo Web, set worker count, then run setup and go.
Limits. A small occupancy illustration with fixed schedules. It cannot establish safe staffing, site capacity or construction logistics.
Earlier example, repaired and reviewed 2 October 2026. This review checks the stated model and interactions; it does not establish usefulness in practice.
GitHub source (may require access)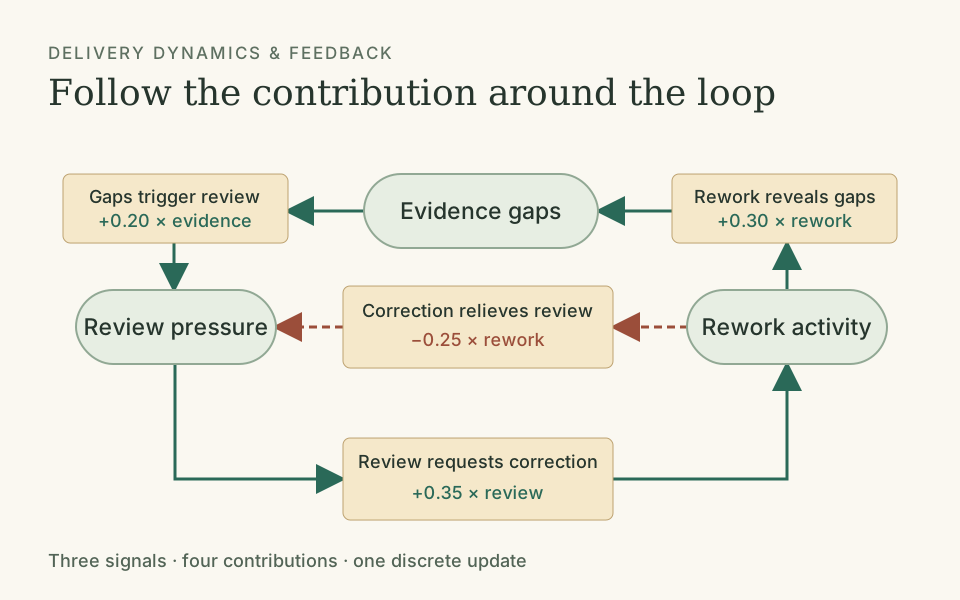
Interactive example
See when feedback settles or grows
Step through a three-state signed feedback model and inspect how contributions and eigenvalues explain its behaviour.
What to try & what it leaves out
Try. Change a gain, follow its contribution through a feedback loop, and compare the trajectory with the stability calculation.
Limits. A discrete linear teaching model with supplied gains; it does not simulate nuclear governance, regulatory approval or a calibrated delivery system.
Earlier example, repaired and reviewed 3 October 2026. This review checks the stated model and interactions; it does not establish usefulness in practice.
GitHub source (may require access)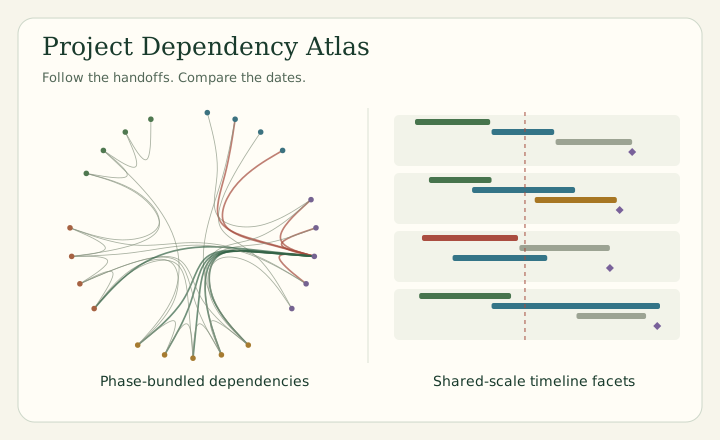
Interactive example
Trace dependencies across phases and time
Compare bundled phase and gate relationships with faceted timelines in four supplied programme views.
What to try & what it leaves out
Try. Select a node to follow its incident dependencies, then inspect dated activities and calendar overlaps in the timeline.
Limits. Illustrative relationships and dates. Calendar overlap alone does not prove resource conflict, criticality or delay.
Earlier example, repaired and reviewed 3 October 2026. This review checks the stated model and interactions; it does not establish usefulness in practice.
GitHub source (may require access)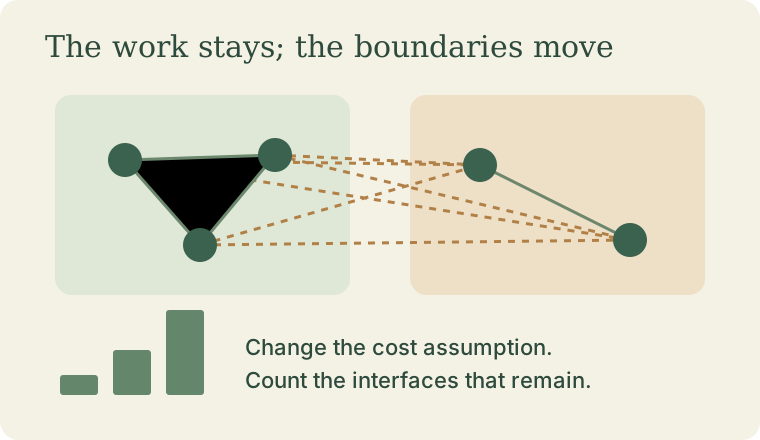
Interactive example
What makes concurrent change costly?
Change the assumed cost curve, split the same work between teams, and count the interfaces that remain.
What to try & what it leaves out
Try. Use three areas and three teams; increase the cost per cross-team pair until splitting costs more.
Limits. Invented cost functions and equal-weight areas; no empirical capacity threshold or calibrated organisational model.
Earlier example, repaired and reviewed 3 October 2026. This review checks the stated model and interactions; it does not establish usefulness in practice.
GitHub source (may require access)