When is evidence worth waiting for?
Six mountain-festival examples explore waiting, surveys, evidence latency and adaptive stopping. Inspect every policy path in the declared toy decision tree.
Explore evidence and commitment →Programme decision sequences
This foray asks how management decisions, evidence gathering and scheduled work can be understood together. The shuttle isolates one part: keeping a useful choice open while information arrives. Delivery itself is represented by fixed payoffs here; the model does not build an operating timetable.
Powell’s framework separates state, decision, new information, transition and objective. Our independently written finite decision tree applies that structure to the shuttle: beliefs change after evidence, and the next choice uses only what has been learned.
It enumerates the declared small model, subject to floating-point arithmetic. It does not train a reinforcement-learning policy or establish a real transport recommendation.
Sources and what the essay adds · Model assumptions · Method and verification · Original foray aim
Start with evidence before commitment
The diagram branches on what the organiser learns. It lets you inspect the next decision under either answer.
Open the six worked examples → The other examples explore unhelpful clarity, routine evidence, stopping and successive tests.
Browse all twelve experiments → Framing worksheets, policy comparisons, paths, an IT game and a clearly marked historical report.
Programme decision sequences
A first example
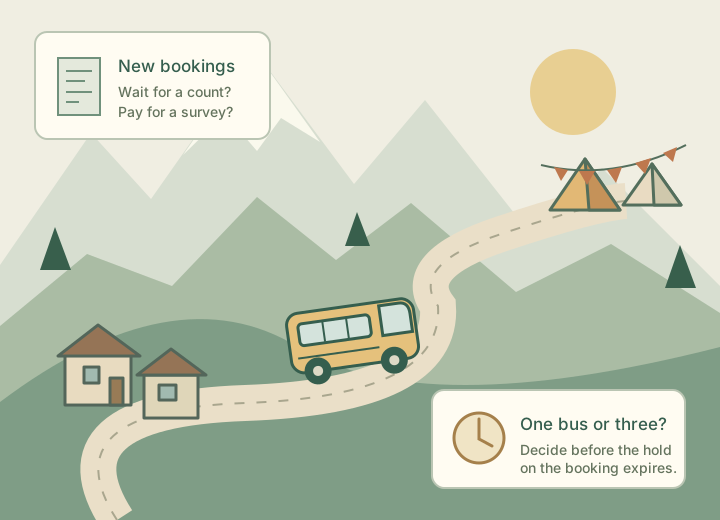
Evidence before commitment asks whether to reserve the shuttle now, wait for new bookings or commission a survey before the hire hold expires.
Twelve experiments for exploring decisions that repeat over time. Start with a model, frame a real question, or play through a small example. Each tool keeps its own purpose and assumptions.
The numerical worlds are illustrative. The evidence essay solves its declared small model exactly; the simulators and game do not establish optimal policies or predict real programmes.
Sequence diagrams make the order of decisions and new information visible; policy comparisons show how supplied decision rules behave; the evidence essay asks what that information is worth when later choices may use only what has arrived.
Six mountain-festival examples explore waiting, surveys, evidence latency and adaptive stopping. Inspect every policy path in the declared toy decision tree.
Explore evidence and commitment →Two organisers can have the same belief and different room to act. Compare a compact decision state, a remaining survey allowance and the record of how they got there.
Explore the handover →The shuttle report turns green. Compare real supplier improvement, a revised target and filtered evidence, then inspect what changes the next commitment.
Explore the next decision →Move the shuttle review time and freshness window. Distinguish when something happened from when its report became available.
Inspect the information available →Vary reporting, correction and action delays in the shuttle preparations. Follow what enters attention and what each response changes.
Explore delayed observation and action →Follow one realised path, compare four policy representatives, inspect a scenario tree and frame a recurring management decision around its information cadence.
Open the sequence model →Compare PFA, CFA, VFA, DLA and hybrid representatives using common seeded shocks. Keep world truth separate from belief; inspect benchmarks, paths, action ribbons and R/I/B framing.
Run the climate policy experiment →Write the narrative, state, actions, new information, transition rule and objective for a decision problem. Generate a readable summary of your own formulation.
Open the framing worksheet →Step through or play two 2028 paths, inspect state/action/information narratives and export the diagram as SVG. Primary sources provide context for the example.
Explore the two paths →Work from a software-project narrative to core elements, a proposed mathematical model, policy design, evaluation and iteration. This guide explains a formulation; it does not run it.
Read the IT tutorial →Hire and allocate developers, commit a week's work, then receive uncertain bug and market information. Compare progress, quality, satisfaction and spend in the chart and full decision history.
Play the weekly project game →Inspect preserved path charts, action sequences, a Sankey view and an editable framing tool. Results are stored figures from an unavailable generating solver with unverified coefficients; controls do not rerun that solver.
Inspect the historical report →